![]() Nick Mastrandrea
Nick Mastrandrea
Market Tea Leaves
Good Morning Traders,
As of this writing 3:50 AM EST, here’s what we see:
US Dollar: Up at 93.040. The US Dollar is up 109 ticks and trading at 93.040.
Energies: June Crude is up at 43.92.
Financials: The June 30 year bond is down 12 ticks and trading at 163.15.
Indices: The June S&P 500 emini ES contract is up 1 tick and trading at 2057.25.
Gold: The June gold contract is trading down at 1284.60. Gold is 72 ticks lower than its close.
Initial Conclusion
This is not a correlated market. The dollar is up+ and crude is up+ which is not normal but the 30 year bond is trading lower. The Financials should always correlate with the US dollar such that if the dollar is lower then bonds should follow and vice-versa. The indices are up fractionally and Crude is trading higher which is not correlated. Gold is trading down which is correlated with the US dollar trading up. I tend to believe that Gold has an inverse relationship with the US Dollar as when the US Dollar is down, Gold tends to rise in value and vice-versa. Think of it as a seesaw, when one is up the other should be down. I point this out to you to make you aware that when we don’t have a correlated market, it means something is wrong. As traders you need to be aware of this and proceed with your eyes wide open.
All of Asia traded lower. As of this writing all of Europe is trading mainly higher with the exception of the London exchange which is down fractionally.
Possible Challenges To Traders Today
– ADP Non-Farm Employment Change is out at 8:15 AM EST. This is major.
– Prelim Nonfarm Productivity q/q at 8:30 AM EST. This is major.
– Prelim Unit Labor Costs q/q is out at 8:30 AM EST. This is major.
– Trade Balance is out at 8:30 AM EST. This is major.
– Final Services PMI is out at 9:45 AM EST. This is major.
– ISM Non-Manufacturing PMI is out at 10 AM EST. This is major.
– Factory Orders m/m is out at 10 AM EST. This is major.
– Crude Oil Inventories are out at 10:30 AM EST. This is major.
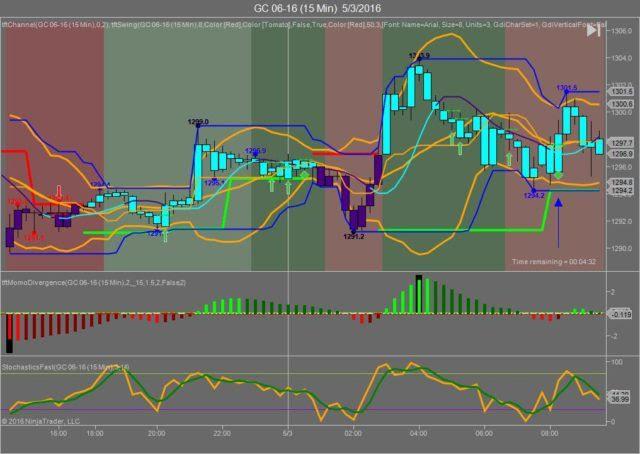
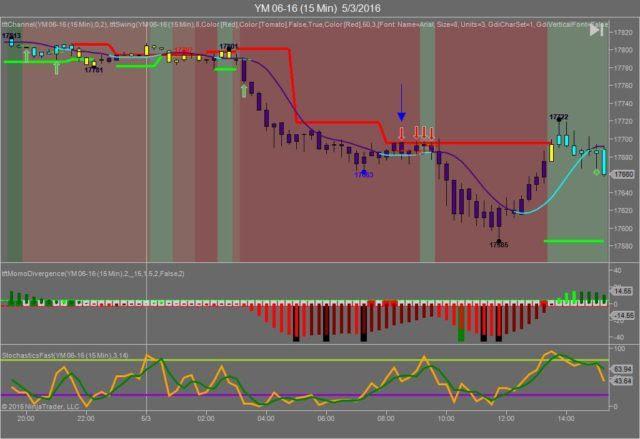
Gold
We’ve elected to switch gears a bit and show correlation between Gold and The YM futures contract. The YM contract is the DJIA and the purpose is to show reverse correlation between the two instruments. Remember it’s liken to a seesaw, when up goes up the other should go down and vice versa.
Yesterday Gold made it’s move at around 8:30 AM EST with no economic news in sight. The YM hit a high at around that time and Gold hit a low. If you look at the charts below the YM gave a signal at around 8:30 AM EST, while Gold also gave a signal at just about the same time. Look at the charts below and you’ll see a pattern for both assets. The YM hit a high at around 8:30 AM EST and Gold hit a low. These charts represent the latest version of Trend Following Trades and I’ve changed the timeframe to a 15 minute chart to display better. This represented a long opportunity on Gold, as a trader you could have netted about 30 plus ticks per contract on this trade. Each tick is worth $10. We added a Donchian Channel to the charts to show the signals more clearly.
Charts Courtesy of Trend Following Trades built on a Ninja Trader platform
Bias
Yesterday we gave the markets a downside bias as Gold and the Bonds were trading higher and this doesn’t bode well for an upside day. The Dow dropped 140 points and the other indices lost ground as well. Today we aren’t dealing with a correlated market and our bias is neutral.
Could this change? Of Course. Remember anything can happen in a volatile market.
Commentary
Yesterday correctly determined that the markets would drop and they did. All we did was to follow our rules of Market Correlation. The Dow closed 140 points lower and the other indices dropped as well. Auto Sales which usually serves to prop up the markets, didn’t. Auto Sales came in at 17.4 versus 17.3 expected but that wasn’t enough to drive the markets higher. Today we have ADP Non-Farm Employment change which is sure to set market direction.
Trading performance displayed herein is hypothetical. The following Commodity Futures Trading Commission (CFTC) disclaimer should be noted.
Hypothetical performance results have many inherent limitations, some of which are described below. No representation is being made that any account will or is likely to achieve profits or losses similar to those shown.
In fact, there are frequently sharp differences between hypothetical performance results and the actual results subsequently achieved by any particular trading program. One of the limitations of hypothetical performance trading results is that they are generally prepared with the benefit of hindsight.
In addition, hypothetical trading does not involve financial risk, and no hypothetical trading record can completely account for the impact of financial risk in actual trading. For example, the ability to withstand losses or to adhere to a particular trading program in spite of trading losses are material points which can also adversely affect actual trading results.
There are numerous other factors related to the markets in general or to the implementation of any specific trading program which cannot be fully accounted for in the preparation of hypothetical performance results and all of which can adversely affect actual trading results.
Trading in the commodities markets involves substantial risk and YOU CAN LOSE A LOT OF MONEY, and thus is not appropriate for everyone. You should carefully consider your financial condition before trading in these markets, and only risk capital should be used.
In addition, these markets are often liquid, making it difficult to execute orders at desired prices. Also, during periods of extreme volatility, trading in these markets may be halted due to so-called “circuit breakers” put in place by the CME to alleviate such volatility. In the event of a trading halt, it may be difficult or impossible to exit a losing position.
Recommended Content
Editors’ Picks
EUR/USD comes under pressure near 1.0630

Further gains in the Greenback encourage sellers to maintain their control over the risk complex, forcing EUR/USD to retreat further and revisit the 1.0630 region as the US session draws to a close.
GBP/USD retreats toward 1.2450 on modest USD rebound

GBP/USD edges lower in the second half of the day and trades at around 1.2450. Better-than-expected Jobless Claims and Philadelphia Fed Manufacturing Index data from the US provides a support to the USD and forces the pair to stay on the back foot.
Gold is closely monitoring geopolitics

Gold trades in positive territory above $2,380 on Thursday. Although the benchmark 10-year US Treasury bond yield holds steady following upbeat US data, XAU/USD continues to stretch higher on growing fears over a deepening conflict in the Middle East.
Ripple faces significant correction as former SEC litigator says lawsuit could make it to Supreme Court

Ripple (XRP) price hovers below the key $0.50 level on Thursday after failing at another attempt to break and close above the resistance for the fourth day in a row.
Have we seen the extent of the Fed rate repricing?

Markets have been mostly consolidating recent moves into Thursday. We’ve seen some profit taking on Dollar longs and renewed demand for US equities into the dip. Whether or not this holds up is a completely different story.