![]() Nick Mastrandrea
Nick Mastrandrea
Market Tea Leaves
Good Morning Traders,
As of this writing 4:10 AM EST, here’s what we see:
US Dollar: Down at 93.440 the US Dollar is down 287 ticks and trading at 93.440.
Energies: June Crude is up at 46.26.
Financials: The June 30 year bond is up 2 ticks and trading at 162.26.
Indices: The June S&P 500 emini ES contract is down 13 ticks and trading at 2069.25.
Gold: The June gold contract is trading up at 1279.00. Gold is 126 ticks higher than its close.
Initial Conclusion
This is not a correlated market. The dollar is down- and crude is up+ which is normal but the 30 year bond is trading higher. The Financials should always correlate with the US dollar such that if the dollar is lower then bonds should follow and vice-versa. The indices are down and Crude is trading higher which is correlated. Gold is trading up which is correlated with the US dollar trading down. I tend to believe that Gold has an inverse relationship with the US Dollar as when the US Dollar is down, Gold tends to rise in value and vice-versa. Think of it as a seesaw, when one is up the other should be down. I point this out to you to make you aware that when we don’t have a correlated market, it means something is wrong. As traders you need to be aware of this and proceed with your eyes wide open.
All of Asia traded lower. As of this writing all of Europe is trading lower.
Possible Challenges To Traders Today
– Core PCE Price Index m/m is out at 8:30 AM EST. This is major.
– Employment Cost Index q/q is out at 8:30 AM EST. This is major.
– Personal Spending m/m is out at 8:30 AM EST. This is major.
– Personal Income m/m is out at 8:30 AM EST. This is major.
– Chicago PMI is out at 9:45 AM EST. This is major.
– Revised UoM Consumer Sentiment is out at 10 AM EST. This is not major.
– Revised UoM Inflation Expectations is out at 10 AM EST. This is not major.
– Treasury Currency Report. This is not major.
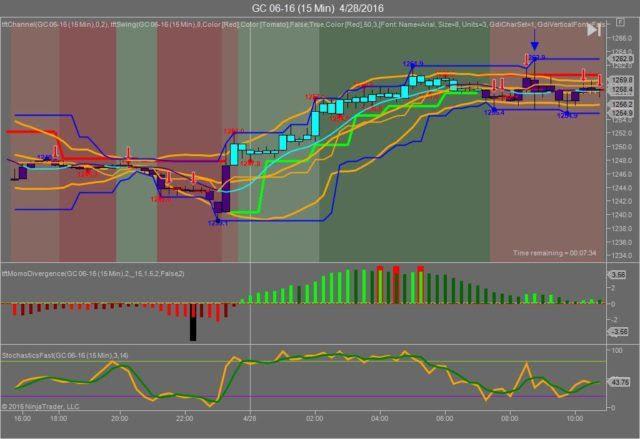
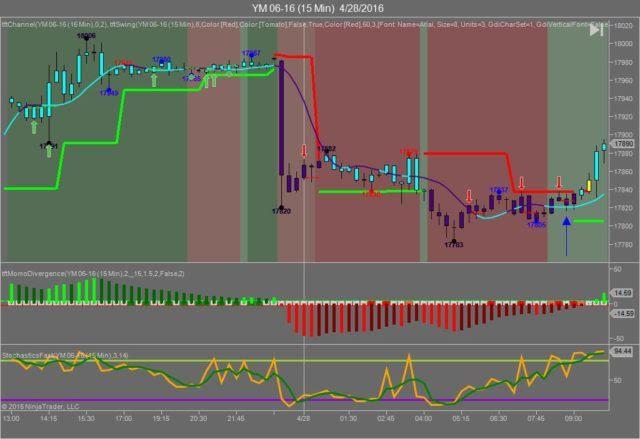
Gold
We’ve elected to switch gears a bit and show correlation between Gold and The YM futures contract. The YM contract is the DJIA and the purpose is to show reverse correlation between the two instruments. Remember it’s liken to a seesaw, when up goes up the other should go down and vice versa.
Yesterday Gold made it’s move at around 8:45 AM EST after the 8:30 news items were reported. The YM hit a high at around that time and Gold hit a low. If you look at the charts below the YM gave a signal at around 8;45 AM EST, while Gold also gave a signal at just about the same time. Look at the charts below and you’ll see a pattern for both assets. The YM hit a low at around 8:45 AM EST and Gold hit a high. These charts represent the latest version of Trend Following Trades and I’ve changed the timeframe to a 15 minute chart to display better. This represented a long opportunity on Gold, as a trader you could have netted about 50 plus ticks per contract on this trade. Each tick is worth $10. We added a Donchian Channel to the charts to show the signals more clearly.
Charts Courtesy of Trend Following Trades built on a NinjaTrader platform
Bias
Yesterday we gave the markets a downside bias as both the Bonds and Gold traded higher yesterday morning and this does not bode well for an upside day. The Dow dropped 211 points and the other indices lost ground as well. Today we aren’t dealing with a correlated market and our bias is to the downside.
Could this change? Of Course. Remember anything can happen in a volatile market.
Commentary
Yesterday we correctly called for a downside day just by following our rules of Market Correlation. The Dow dropped 211 points and the other indices dropped as well. Advance GDP came out at 8:30 AM EST yesterday that did not meet expectation coming in at 0.5% versus 0.7% expected. The markets dropped on this news and never ventured into positive territory. The Fed was correct in not hiking rates on Wednesday as that probably would have resulted in a further down slide. Today we have a virtual tsunami of economic reports so we’ll have to monitor accordingly.
Trading performance displayed herein is hypothetical. The following Commodity Futures Trading Commission (CFTC) disclaimer should be noted.
Hypothetical performance results have many inherent limitations, some of which are described below. No representation is being made that any account will or is likely to achieve profits or losses similar to those shown.
In fact, there are frequently sharp differences between hypothetical performance results and the actual results subsequently achieved by any particular trading program. One of the limitations of hypothetical performance trading results is that they are generally prepared with the benefit of hindsight.
In addition, hypothetical trading does not involve financial risk, and no hypothetical trading record can completely account for the impact of financial risk in actual trading. For example, the ability to withstand losses or to adhere to a particular trading program in spite of trading losses are material points which can also adversely affect actual trading results.
There are numerous other factors related to the markets in general or to the implementation of any specific trading program which cannot be fully accounted for in the preparation of hypothetical performance results and all of which can adversely affect actual trading results.
Trading in the commodities markets involves substantial risk and YOU CAN LOSE A LOT OF MONEY, and thus is not appropriate for everyone. You should carefully consider your financial condition before trading in these markets, and only risk capital should be used.
In addition, these markets are often liquid, making it difficult to execute orders at desired prices. Also, during periods of extreme volatility, trading in these markets may be halted due to so-called “circuit breakers” put in place by the CME to alleviate such volatility. In the event of a trading halt, it may be difficult or impossible to exit a losing position.
Recommended Content
Editors’ Picks
EUR/USD clings to daily gains above 1.0650

EUR/USD gained traction and turned positive on the day above 1.0650. The improvement seen in risk mood following the earlier flight to safety weighs on the US Dollar ahead of the weekend and helps the pair push higher.
GBP/USD recovers toward 1.2450 after UK Retail Sales data

GBP/USD reversed its direction and advanced to the 1.2450 area after touching a fresh multi-month low below 1.2400 in the Asian session. The positive shift seen in risk mood on easing fears over a deepening Iran-Israel conflict supports the pair.
Gold holds steady at around $2,380 following earlier spike

Gold stabilized near $2,380 after spiking above $2,400 with the immediate reaction to reports of Israel striking Iran. Meanwhile, the pullback seen in the US Treasury bond yields helps XAU/USD hold its ground.
Bitcoin Weekly Forecast: BTC post-halving rally could be partially priced in Premium

Bitcoin price shows no signs of directional bias while it holds above $60,000. The fourth BTC halving is partially priced in, according to Deutsche Bank’s research.
Geopolitics once again take centre stage, as UK Retail Sales wither

Nearly a week to the day when Iran sent drones and missiles into Israel, Israel has retaliated and sent a missile into Iran. The initial reports caused a large uptick in the oil price.