![]() Nick Mastrandrea
Nick Mastrandrea
Market Tea Leaves
Good Morning Traders,
As of this writing 4:10 AM EST, here’s what we see:
US Dollar: Down at 93.760 the US Dollar is down 607 ticks and trading at 93.760.
Energies: June Crude is down at 45.20.
Financials: The June 30 year bond is up 15 ticks and trading at 163.05.
Indices: The June S&P 500 emini ES contract is down 58 ticks and trading at 2076.25.
Gold: The June gold contract is trading up at 1257.50. Gold is 71 ticks higher than its close.
Initial Conclusion
This is not a correlated market. The dollar is down- and crude is down- which is not normal but the 30 year bond is trading higher. The Financials should always correlate with the US dollar such that if the dollar is lower then bonds should follow and vice-versa. The indices are down and Crude is trading lower which is not correlated. Gold is trading up which is correlated with the US dollar trading down. I tend to believe that Gold has an inverse relationship with the US Dollar as when the US Dollar is down, Gold tends to rise in value and vice-versa. Think of it as a seesaw, when one is up the other should be down. I point this out to you to make you aware that when we don’t have a correlated market, it means something is wrong. As traders you need to be aware of this and proceed with your eyes wide open.
Asia traded mainly lower with the exception of the Hang Seng exchange which traded higher. As of this writing all of Europe is trading lower.
Possible Challenges To Traders Today
– Advance GDP q/q is out at 8:30 AM EST. This is major.
– Advance GDP Price Index q/q is out at 8:30 AM EST. This is major.
– Unemployment Claims are out at 8:30 AM EST. This is major.
– Natural Gas Storage is out at 10:30 AM EST. This is major.
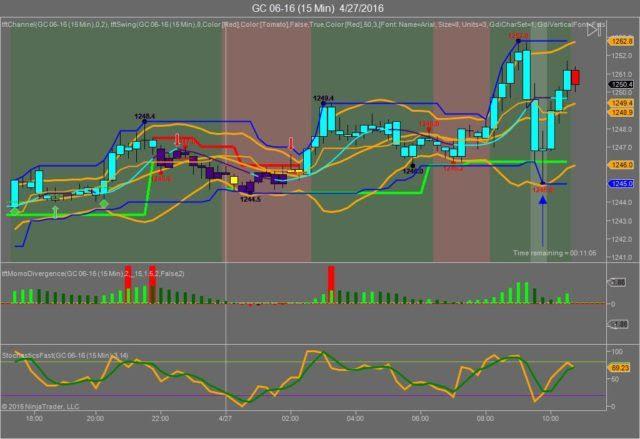
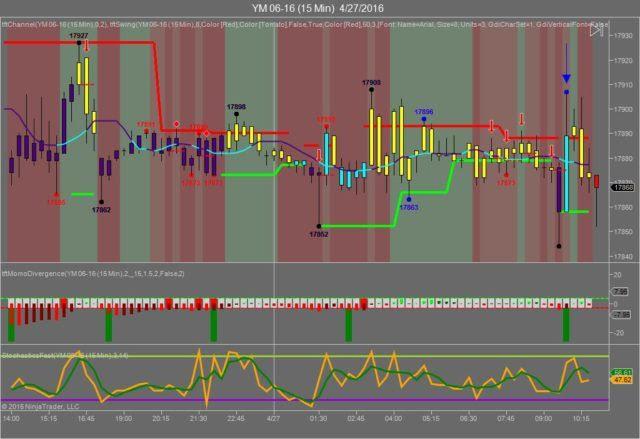
Gold
We’ve elected to switch gears a bit and show correlation between Gold and The YM futures contract. The YM contract is the DJIA and the purpose is to show reverse correlation between the two instruments. Remember it’s liken to a seesaw, when up goes up the other should go down and vice versa.
Yesterday Gold made its move at around 9:45 AM EST prior to the Pending Home Sales number reported. The YM hit a high at around that time and Gold hit a low. If you look at the charts below the YM gave a signal at around 8 AM EST, while Gold also gave a signal at just about the same time. Look at the charts below and you’ll see a pattern for both assets. The YM hit a high at around 9:45 AM EST and Gold hit a low. These charts represent the latest version of Trend Following Trades and I’ve changed the timeframe to a 15 minute chart to display better. This represented a long opportunity on Gold, as a trader you could have netted about 50 plus ticks per contract on this trade. Each tick is worth $10. We added a Donchian Channel to the charts to show the signals more clearly.
Charts Courtesy of Trend Following Trades built on a NinjaTrader platform
Bias
Yesterday we gave the markets a neutral bias as it was FOMC Day and we always maintain a neutral bias on that day. The Dow closed higher by 51 points, the S&P gained 3 but the Nasdaq closed lower by 25 points. Today we aren’t dealing with a correlated market and our bias is to the downside.
Could this change? Of Course. Remember anything can happen in a volatile market.
Commentary
Yesterday we correctly stated that the Fed probably wouldn’t raise rates and gratefully they didn’t. To do so at this particular time would not be a wise move on the Fed’s part for a number of reasons. First, quarterly earnings across the board are down and if you need proof of this just look at what to Apple recently. Second, GDP (which ironically will be reported today) has not been as robust as in previous recoveries. Third, although the Jobs Numbers have been better, the jobs being created aren’t paying living wages. Lastly, if the Fed wanted to torpedo an already fragile recovery then raising rates would do the trick. The US economy needs consumer spending in order to have any semblance of recovery and raising rates would make consumers more prone to run for cover and it isn’t just for everyday items but major expenditures like buying a car. remodeling a home, etc. As we stated previously Advance GDP will be reported today and provide us with some insight as to what the future holds.
Trading performance displayed herein is hypothetical. The following Commodity Futures Trading Commission (CFTC) disclaimer should be noted.
Hypothetical performance results have many inherent limitations, some of which are described below. No representation is being made that any account will or is likely to achieve profits or losses similar to those shown.
In fact, there are frequently sharp differences between hypothetical performance results and the actual results subsequently achieved by any particular trading program. One of the limitations of hypothetical performance trading results is that they are generally prepared with the benefit of hindsight.
In addition, hypothetical trading does not involve financial risk, and no hypothetical trading record can completely account for the impact of financial risk in actual trading. For example, the ability to withstand losses or to adhere to a particular trading program in spite of trading losses are material points which can also adversely affect actual trading results.
There are numerous other factors related to the markets in general or to the implementation of any specific trading program which cannot be fully accounted for in the preparation of hypothetical performance results and all of which can adversely affect actual trading results.
Trading in the commodities markets involves substantial risk and YOU CAN LOSE A LOT OF MONEY, and thus is not appropriate for everyone. You should carefully consider your financial condition before trading in these markets, and only risk capital should be used.
In addition, these markets are often liquid, making it difficult to execute orders at desired prices. Also, during periods of extreme volatility, trading in these markets may be halted due to so-called “circuit breakers” put in place by the CME to alleviate such volatility. In the event of a trading halt, it may be difficult or impossible to exit a losing position.
Recommended Content
Editors’ Picks
EUR/USD rises toward 1.0700 after Germany and EU PMI data

EUR/USD gains traction and rises toward 1.0700 in the European session on Monday. HCOB Composite PMI data from Germany and the Eurozone came in better than expected, providing a boost to the Euro. Focus shifts US PMI readings.
GBP/USD holds above 1.2350 after UK PMIs

GBP/USD clings to modest daily gains above 1.2350 in the European session on Tuesday. The data from the UK showed that the private sector continued to grow at an accelerating pace in April, helping Pound Sterling gather strength.
Gold price flirts with $2,300 amid receding safe-haven demand, reduced Fed rate cut bets

Gold price (XAU/USD) remains under heavy selling pressure for the second straight day on Tuesday and languishes near its lowest level in over two weeks, around the $2,300 mark heading into the European session.
Here’s why Ondo price hit new ATH amid bearish market outlook Premium

Ondo price shows no signs of slowing down after setting up an all-time high (ATH) at $1.05 on March 31. This development is likely to be followed by a correction and ATH but not necessarily in that order.
US S&P Global PMIs Preview: Economic expansion set to keep momentum in April

S&P Global Manufacturing PMI and Services PMI are both expected to come in at 52 in April’s flash estimate, highlighting an ongoing expansion in the private sector’s economic activity.