![]() Nick Mastrandrea
Nick Mastrandrea
Market Tea Leaves
Good Morning Traders,
As of this writing 5:10 AM EST, here’s what we see:
US Dollar: Down at 82.405, the US Dollar is down 44 ticks and is trading at 82.405.
Energies: October Crude is down at 93.57.
Financials: The Sept 30 year bond is up 3 ticks and trading at 141.08.
Indices: The Sept S&P 500 emini ES contract is down 10 ticks and trading at 1994.50.
Gold: The October gold contract is trading up at 1289.00 and is up 65 ticks from its close.
Initial Conclusion
This is not correlated market. The dollar is down- and oil is down- which is not normal but the 30 year bond is trading higher. The Financials should always correlate with the US dollar such that if the dollar is lower then bonds should follow and vice-versa. The indices are down and the US dollar is trading down which is not correlated. Gold is trading higher which is correlated with the US dollar trading down. I tend to believe that Gold has an inverse relationship with the US Dollar as when the US Dollar is down, Gold tends to rise in value and vice-versa. Think of it as a seesaw, when one is up the other should be down. I point this out to you to make you aware that when we don’t have a correlated market, it means something is wrong. As traders you need to be aware of this and proceed with your eyes wide open.
Asia traded mainly lower with the exception of the Sensex exchange which traded higher. As of this writing all of Europe is trading lower.
Possible Challenges To Traders Today
Prelim GDP q/q is out at 8:30 AM EST. This is major.
Prelim GDP Price Index q/q is out at 8:30 AM EST. This is major.
Unemployment Claims are out at 8:30 AM EST. This is major.
Pending Home Sales m/m are out at 10 AM EST. This is major.
Natural Gas Storage is out at 10:30 AM EST. This could move the Nat Gas market.
Currencies
Yesterday the Swiss Franc made it’s move at around 9 AM EST with no real economic news in sight. The USD hit a low at around that time and the Swiss Franc hit a high. If you look at the charts below the USD gave a signal at around 9 AM EST, while the Swiss Franc also gave a signal at just about the same time. Look at the charts below and you’ll see a pattern for both assets. The USD hit a low at 9 AM EST and the Swiss Franc hit a high. I’ve changed the charts to reflect a 5 minute time frame and added a Darvas Box to make it more clear. This represented a shorting opportunity on the Swiss Franc, as a trader you could have netted 12-15 ticks on this trade. Remember each tick on the Swiss Franc is equal to $12.50 versus $10.00 that we usually see for currencies.
Charts Courtesy of Trend Following Trades built on a NinjaTrader platform


Bias
Yesterday we said our bias was to the upside as the USD was down and Crude was up. The Dow gained 15 points, the Nasdaq dropped by 1 and the S&P came in dead even at 2,000. Today we aren’t dealing with a correlated market and our bias is neutral.
Could this change? Of Course. Remember anything can happen in a volatile market.
Commentary
Yesterday we said our bias was to the upside as the USD was trading down and crude was trading higher. Crude trading higher is typically bullish for the markets. As of late the bonds have been acting peculiar as they always seem to go up in the early AM hours even though there’s no justification for it. There was no major economic news today (except crude oil inventories which is usual and customary for a Wednesday) so the markets were left to their own devices. The good news is the S&P has remained at 2,000 and didn’t budge. This is not usual but shows strength and is a good sign going forward. Time will tell if it maintains and holds at this level.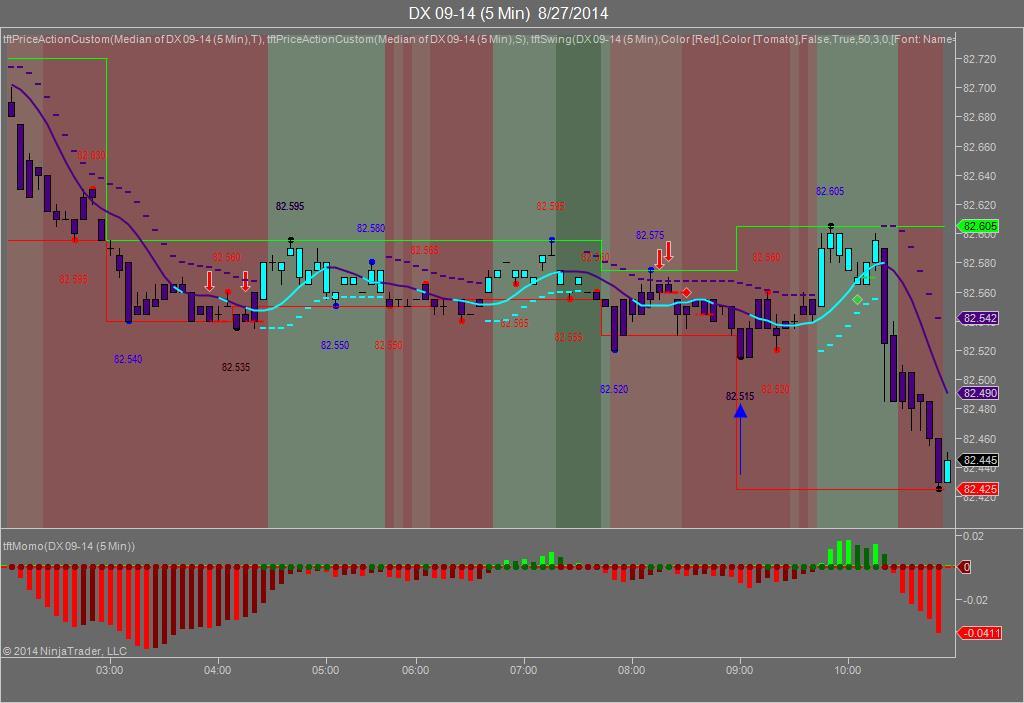
Trading performance displayed herein is hypothetical. The following Commodity Futures Trading Commission (CFTC) disclaimer should be noted.
Hypothetical performance results have many inherent limitations, some of which are described below. No representation is being made that any account will or is likely to achieve profits or losses similar to those shown.
In fact, there are frequently sharp differences between hypothetical performance results and the actual results subsequently achieved by any particular trading program. One of the limitations of hypothetical performance trading results is that they are generally prepared with the benefit of hindsight.
In addition, hypothetical trading does not involve financial risk, and no hypothetical trading record can completely account for the impact of financial risk in actual trading. For example, the ability to withstand losses or to adhere to a particular trading program in spite of trading losses are material points which can also adversely affect actual trading results.
There are numerous other factors related to the markets in general or to the implementation of any specific trading program which cannot be fully accounted for in the preparation of hypothetical performance results and all of which can adversely affect actual trading results.
Trading in the commodities markets involves substantial risk and YOU CAN LOSE A LOT OF MONEY, and thus is not appropriate for everyone. You should carefully consider your financial condition before trading in these markets, and only risk capital should be used.
In addition, these markets are often liquid, making it difficult to execute orders at desired prices. Also, during periods of extreme volatility, trading in these markets may be halted due to so-called “circuit breakers” put in place by the CME to alleviate such volatility. In the event of a trading halt, it may be difficult or impossible to exit a losing position.
Recommended Content
Editors’ Picks
AUD/USD remained bid above 0.6500

AUD/USD extended further its bullish performance, advancing for the fourth session in a row on Thursday, although a sustainable breakout of the key 200-day SMA at 0.6526 still remain elusive.
EUR/USD faces a minor resistance near at 1.0750

EUR/USD quickly left behind Wednesday’s small downtick and resumed its uptrend north of 1.0700 the figure, always on the back of the persistent sell-off in the US Dollar ahead of key PCE data on Friday.
Gold holds around $2,330 after dismal US data

Gold fell below $2,320 in the early American session as US yields shot higher after the data showed a significant increase in the US GDP price deflator in Q1. With safe-haven flows dominating the markets, however, XAU/USD reversed its direction and rose above $2,340.
Bitcoin price continues to get rejected from $65K resistance as SEC delays decision on spot BTC ETF options

Bitcoin (BTC) price has markets in disarray, provoking a broader market crash as it slumped to the $62,000 range on Thursday. Meanwhile, reverberations from spot BTC exchange-traded funds (ETFs) continue to influence the market.
US economy: slower growth with stronger inflation

The dollar strengthened, and stocks fell after statistical data from the US. The focus was on the preliminary estimate of GDP for the first quarter. Annualised quarterly growth came in at just 1.6%, down from the 2.5% and 3.4% previously forecast.