Good Morning Traders,
As of this writing 5:30 AM EST, here’s what we see:
US Dollar: Up at 80.550, the US Dollar is up 104 ticks and is trading at 80.550.
Energies: Aug Oil is up at 100.78.
Financials: The Sept 30 year bond is up 6 ticks and trading at 137.04.
Indices: The Sept S&P 500 emini ES contract is up 21 ticks and trading at 1973.25.
Gold: The August gold contract is trading up at 1298.50 and is up 13 ticks from its close.
Initial Conclusion
This is not correlated market. The dollar is up+ and oil is up+ which is not normal and the 30 year bond is trading higher. The Financials should always correlate with the US dollar such that if the dollar is lower then bonds should follow and vice-versa. The indices are higher and the US dollar is trading up which is not correlated. Gold is trading higher which is not correlated with the US dollar trading up. I tend to believe that Gold has an inverse relationship with the US Dollar as when the US Dollar is down, Gold tends to rise in value and vice-versa. Think of it as a seesaw, when one is up the other should be down. I point this out to you to make you aware that when we don’t have a correlated market, it means something is wrong. As traders you need to be aware of this and proceed with your eyes wide open.
Asia traded mainly higher with the exception of the Nikkei and Shanghai exchanges which traded lower. As of this writing all of Europe is trading is trading lower.
Possible Challenges To Traders Today
PPI m/m is out at 8:30 AM EST. This is major.
Core PPI m/m is out at 8:30 AM EST. This is major.
TIC Long-Term Purchases is out at 9 AM EST. This is not major.
Capacity Utilization Rate is out at 9:15 AM EST. This is not major.
Industrial Production m/m is out at 9:15 AM EST. This is not major.
Fed Chair Yellen Testifies at 10 AM EST. This is major.
NAHB Housing Market Index is out at 10 AM EST. This is major.
Crude Oil Inventories is out at 10:30 AM EST. This could move the crude market.
FOMC Member Fisher Speaks at 12 PM. This is major.
Beige Book is out at 2 PM EST. This could affect afternoon trading.
Currencies
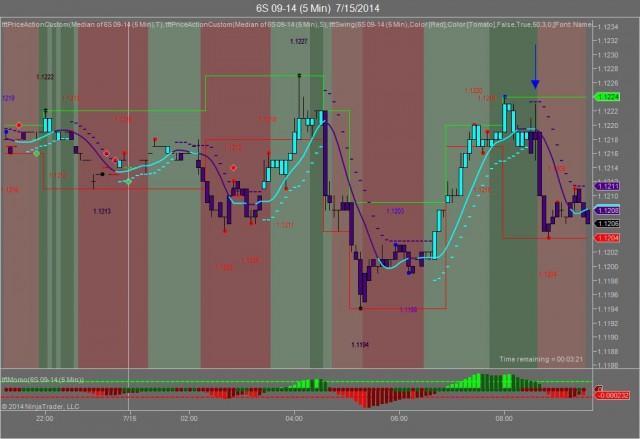
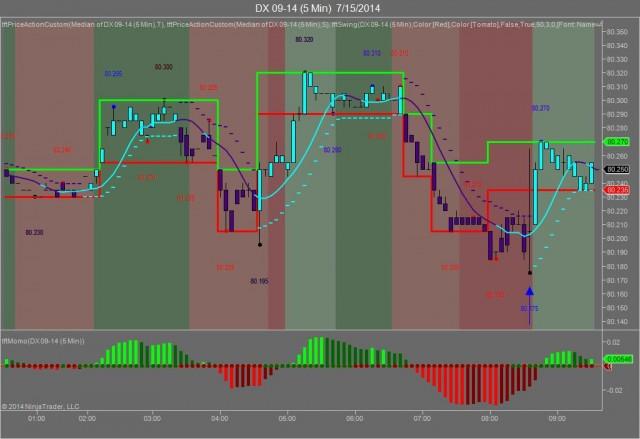
Yesterday the Swiss Franc made its move at 8:35 AM EST after the Retail Sales numbers were released. The USD hit a low at around that time and the Swiss Franc hit a high. If you look at the charts below the USD gave a signal at 8:35 AM EST, while the Swiss Franc also gave a signal at just about the same time. Look at the charts below and you’ll see a pattern for both assets. The USD hit a low at 8:35 AM EST and the Swiss Franc hit a high. I’ve changed the charts to reflect a 5 minute time frame and added a Darvas Box to make it more clear. This represented a shorting opportunity on the Swiss Franc, as a trader you could have netted 15-20 ticks on that trade. Remember each tick on the Swiss Franc is equal to $12.50 versus $10.00 that we usually see for currencies.
Charts Courtesy of Trend Following Trades built on a NinjaTrader platform
Bias
Yesterday we said our bias was neutral which means the markets could go in any direction. The Dow gained a paltry 6 points but the other indices lost ground. Today we aren’t dealing with a correlated market and will maintain a neutral bias (members watch the Market Bias video for an in-depth explanation).
Could this change? Of Course. Remember anything can happen in a volatile market.
Commentary
Yesterday we said our bias was neutral which means the markets could go in any direction and in fact they did. In our Market Bias video yesterday we stated that ordinarily our bias would be to the downside as the Financials (USD and Bonds) were trading higher, Europe was trading lower and Gold was trading much higher. Readers of this newsletter knew this at 6 AM. How did we know that? Our rules of market correlation told us so. Just so you understand, Market Correlation is Market Direction. It attempts to determine the market direction for that day and it does so by using a unique set of tools.
Trading performance displayed herein is hypothetical. The following Commodity Futures Trading Commission (CFTC) disclaimer should be noted.
Hypothetical performance results have many inherent limitations, some of which are described below. No representation is being made that any account will or is likely to achieve profits or losses similar to those shown.
In fact, there are frequently sharp differences between hypothetical performance results and the actual results subsequently achieved by any particular trading program. One of the limitations of hypothetical performance trading results is that they are generally prepared with the benefit of hindsight.
In addition, hypothetical trading does not involve financial risk, and no hypothetical trading record can completely account for the impact of financial risk in actual trading. For example, the ability to withstand losses or to adhere to a particular trading program in spite of trading losses are material points which can also adversely affect actual trading results.
There are numerous other factors related to the markets in general or to the implementation of any specific trading program which cannot be fully accounted for in the preparation of hypothetical performance results and all of which can adversely affect actual trading results.
Trading in the commodities markets involves substantial risk and YOU CAN LOSE A LOT OF MONEY, and thus is not appropriate for everyone. You should carefully consider your financial condition before trading in these markets, and only risk capital should be used.
In addition, these markets are often liquid, making it difficult to execute orders at desired prices. Also, during periods of extreme volatility, trading in these markets may be halted due to so-called “circuit breakers” put in place by the CME to alleviate such volatility. In the event of a trading halt, it may be difficult or impossible to exit a losing position.
Recommended Content
Editors’ Picks
AUD/USD failed just ahead of the 200-day SMA

Finally, AUD/USD managed to break above the 0.6500 barrier on Wednesday, extending the weekly recovery, although its advance faltered just ahead of the 0.6530 region, where the key 200-day SMA sits.
EUR/USD met some decent resistance above 1.0700

EUR/USD remained unable to gather extra upside traction and surpass the 1.0700 hurdle in a convincing fashion on Wednesday, instead giving away part of the weekly gains against the backdrop of a decent bounce in the Dollar.
Gold keeps consolidating ahead of US first-tier figures

Gold finds it difficult to stage a rebound midweek following Monday's sharp decline but manages to hold above $2,300. The benchmark 10-year US Treasury bond yield stays in the green above 4.6% after US data, not allowing the pair to turn north.
Bitcoin price could be primed for correction as bearish activity grows near $66K area

Bitcoin (BTC) price managed to maintain a northbound trajectory after the April 20 halving, despite bold assertions by analysts that the event would be a “sell the news” situation. However, after four days of strength, the tables could be turning as a dark cloud now hovers above BTC price.
Bank of Japan's predicament: The BOJ is trapped

In this special edition of TradeGATEHub Live Trading, we're joined by guest speaker Tavi @TaviCosta, who shares his insights on the Bank of Japan's current predicament, stating, 'The BOJ is Trapped.'

