![]() Andre Gratian
Andre Gratian
Market Turning Points
"By the Law of Periodical Repetition, everything which has happened once must happen again, and again, and again -- and not capriciously, but at regular periods, and each thing in its own period, not another's, and each obeying its own law... The same Nature which delights in periodical repetition in the sky is the Nature which orders the affairs of the earth. Let us not underrate the value of that hint." ~ Mark Twain
Current Position of the Market
SPX Long-term trend: The beginning of a lengthy correction is most likely underway!
SPX Intermediate trend: Rally top.
Analysis of the short-term trend is done on a daily basis with the help of hourly charts. It is an important adjunct to the analysis of daily and weekly charts which discuss longer market trends.
Market Overview
Last week cleared up some of the ambiguities that existed in the overall market. The recent strength in DJIA, SPX and the NYSE breadth were beginning to contradict earlier assessments that the bull market had ended at SPX 2135 and that a major correction had started. Certainly, being focused solely on these two major averages did give that impression, although a quick look at the following charts (courtesy of Qcharts.com) (DJIA on the left and TRAN on the right) should quickly have dispelled such a notion. You don’t have to be a DOW Theorist scholar to appreciate the meaning of the relative performance of these two averages.
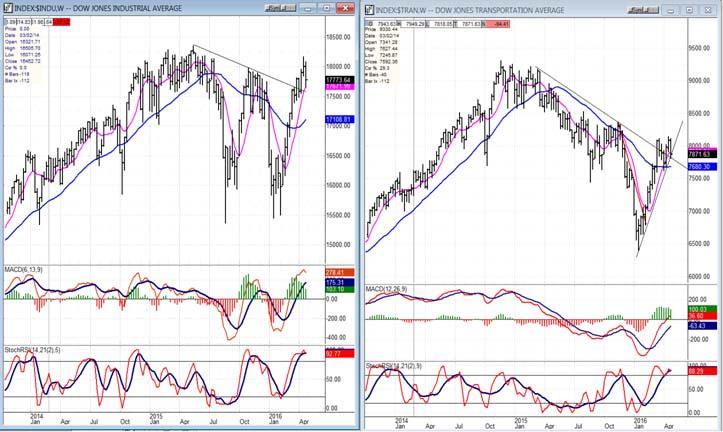
In earlier letters, I showed performance discrepancies between other leading indexes and SPX which also strongly questioned the validity of the strength of the main averages. Until this strength came to an end however, it was perfectly normal for the bears to doubt their market perspective.
Last week’s market performance has begun to shift the burden of proof from the bears back to the bulls. The rally from 1810 has apparently come to an end at the proposed projection levels, and a reversal has taken place which, judging by the amount of distribution established at the top, has started a correction which should have farther to go. For the moment, we’ll just call it a correction and not a resumption of the primary (estimated to be bearish) trend until exhibits some staying power.
A standout among the weakest performers last week was the NDX, which registered its worst decline in months, causing its chart pattern to look very similar to how last December’s decline correction started. The preceding rally had already showed relative weakness to SPX, but last week’s action has made it the new leader on the downside.
It has only been two weeks since the SPX rally came to an end at 2111, so we can’t yet draw hard and fast conclusions about the nature of this decline but, if the top projections are correct, we are not even half way to its low, yet.
SPX Chart Analysis
Daily chart (This chart, and others below, are courtesy of QCharts.com.)
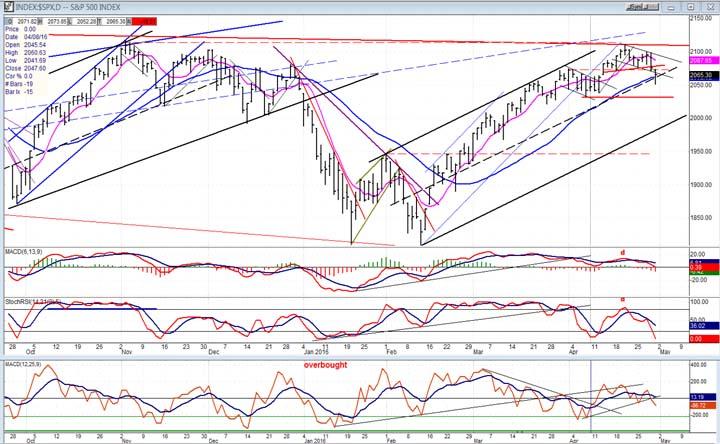
It is clear from the action of the price and of the indicators that a temporary end, at least, has come to the rally which started at 1810. By dropping below its lower minor channel line on Friday, it is suggesting that it is not simply consolidating as it did after the former minor top. It also broke a minor support level and entered a congestion area which temporarily stopped the decline.
So far, only about half if its intermediate channel has been retraced and, if this decline is to go and challenge the lower channel line, it will have to get past the horizontal red line which is currently the greatest obstacle to a downward expansion of the trend. There has been enough distribution above the red dashed line to suggest that it should not have too much difficulty in doing so.
As another sign that this is a top, we could point to what is a potential H&S pattern which formed over the past three weeks of trading. Friday’s action would constitute the breaking of the neck line and perhaps, at the same time, the start of a rally to the neck line.
The behavior of the indicators gives the most solid confirmation that a correction has started. All three oscillators gave an advance warning when they displayed negative divergence at the very top, just prior to turning down. Since then, they have started a decline during which the momentum indicators have already reached below their former lows, thereby continuing to show negative divergence.
As mentioned in the previous articles, breadth has been distorted by an oversold rally in all the commodities-related equities, but this did not stop the A/D indicator from showing divergence at the top of the move and turning down with the momentum oscillators.
Hourly chart
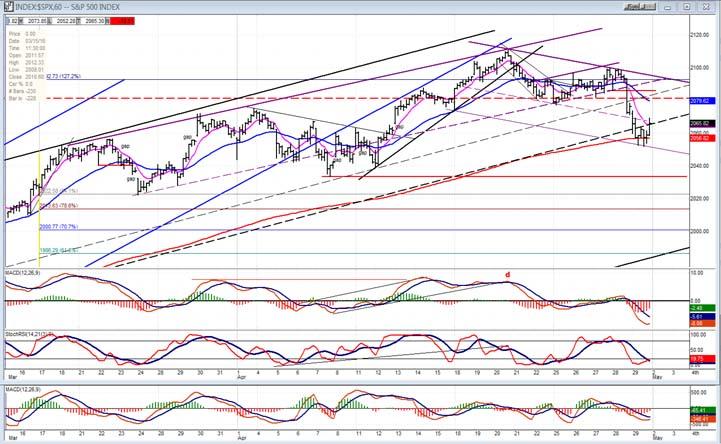
When it first declined from the top, the index immediately found support at the level of a previous high and attempted to rally. This was a choppy and sluggish affair which did manage to last about three days while it formed a mildly up-slanted minor channel having much more the appearance of distribution than that of accumulation for another go at the top. The bottom of the channel was reinforced by a trend line which was parallel to the secondary top trend line and which had many previous support points. Therefore, it was no surprise that, when the bottom of the channel gave way, price took a quick plunge lower, finally finding new support on the red 200-DMA. Since that level also corresponded to distribution that had formed between the two minor channel tops, it was an obvious place for the bounce that took place after re-testing the first low.
If the first phase of the decline was impulsive (which it could be), then the top of the rally could be wave 2, and the second down-phase may be the beginning of wave 3 (1 of 3) which may not be quite complete, since we could extend the range of the count a few points lower. This would allow the indicators to complete their downward patterns and get ready to turn up for an initial counter-trend bounce.
SPX et al…
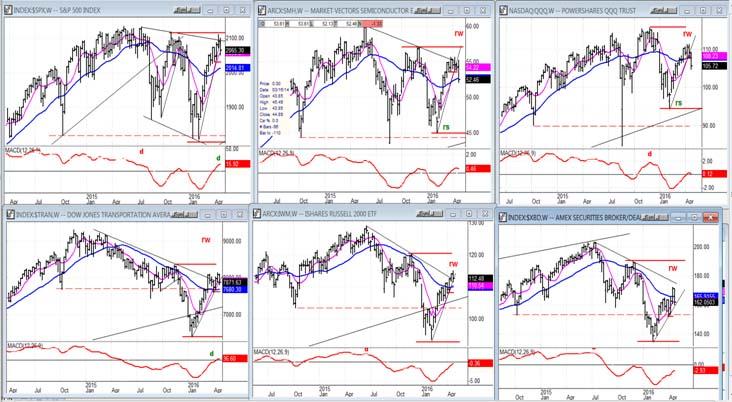
Now that we have one week on the downside, we can more readily see what an anomaly it was for the SPX to be as strong as it was. The QQQ was the one index that, at the former top, had suggested that the bull market might not be over; but it failed miserably to keep pace with SPX during this rally and it has been the first to start the correction with a bang! It was joined by the semi-conductor index (SMH) whose long-term trend is even weaker since it failed to get anywhere close to its high at the November top. Last week’s weakness in these two indices alone should be enough to warn the bulls that something is not right in the overall market. But then, the TRAN, IWM and XBD have already been telling us this since last July -- and even since January 2015 in the case of TRAN.
Of course in spite of the long-term bearish appearance of this lot, continuing weakness will be necessary to convince us that the overall market is engaged in something more than just a minor correction.
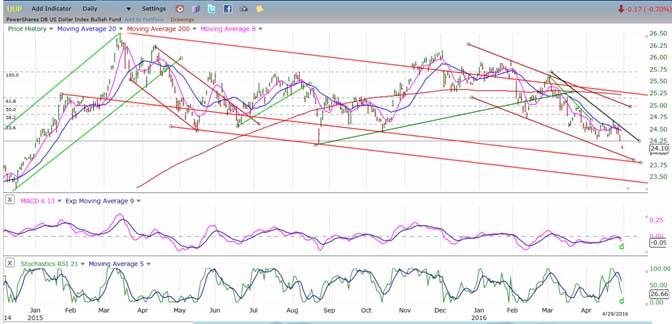
UUP (Dollar ETF)
UUP has not completed its correction which, according the P&F chart, could extend to 23.70-24.10. Since 24.10 was reached on Friday, we could get a bounce or even reverse from this level. With increasing positive divergence appearing in the daily indicators, a low of sorts in this general area is likely and not too far away.
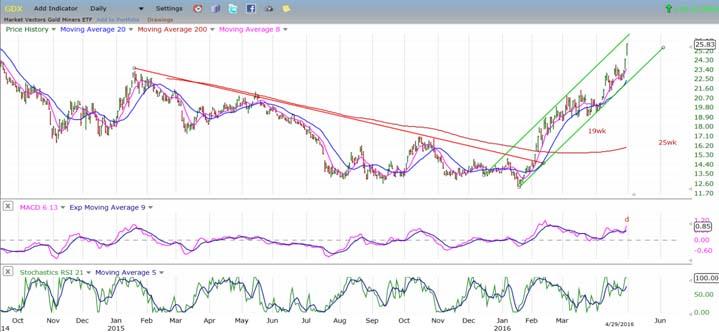
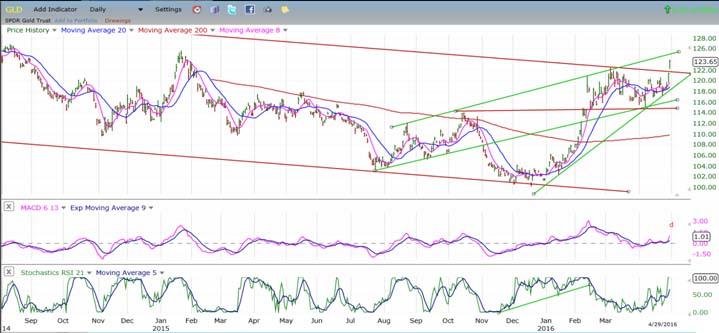
GDX (Gold Miners ETF)
The precious metals have taken advantage of the dollar weakness to extend their move. The miners have been particularly aggressive, but even GLD (posted below) managed to make a new high as it moved out of its channel top. One day is not enough for a confirmed break-out and it will have to do better than that, especially with negative divergence appearing in the MACD. However, the P&F chart suggests that it could move up another 2 or 3 points, while GDX could reach as high as 28 before beginning a reversal into the 25-wk cycle low.
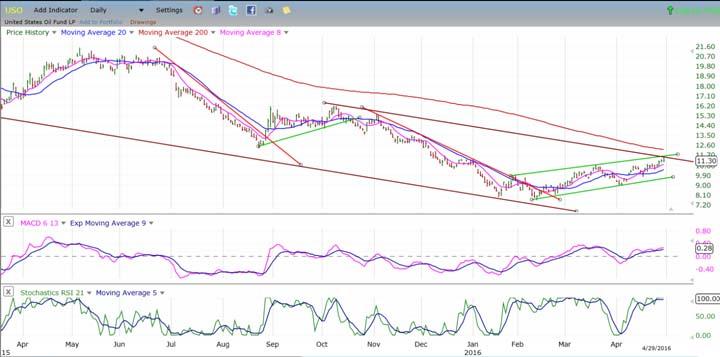
USO (US Oil Trust)
USO may be reaching the limits of its rally from the low, although it could still rise up to a point higher before requiring some serious base-building.
Summary
Last week’s action confirmed the validity of the stated projections, as the SPX apparently started a correction which could span one third of its advance from 1810. What comes afterward will be far more telling, since this is a correction that was expected; especially now that one of the last holdouts of the leading indicators, the NDX, is now joining the ranks of others which, before it had refused to confirm the strength exhibited by the SPX and DJIA.
The weekly charts of five important indexes (which are posted above) make for an impressive display of relative weakness to the SPX. Let’s see what they look like six weeks from now.
The comments made in the daily updates and the Market Summary about the financial markets are based purely on what I consider to be sound technical analysis principles. They represent my own opinion and are not meant to be construed as trading or investment advice, but are offered as an analytical point of view which might be of interest to those who follow stock market cycles and technical analysis.
Recommended Content
Editors’ Picks
EUR/USD clings to daily gains above 1.0650

EUR/USD gained traction and turned positive on the day above 1.0650. The improvement seen in risk mood following the earlier flight to safety weighs on the US Dollar ahead of the weekend and helps the pair push higher.
GBP/USD recovers toward 1.2450 after UK Retail Sales data

GBP/USD reversed its direction and advanced to the 1.2450 area after touching a fresh multi-month low below 1.2400 in the Asian session. The positive shift seen in risk mood on easing fears over a deepening Iran-Israel conflict supports the pair.
Gold holds steady at around $2,380 following earlier spike

Gold stabilized near $2,380 after spiking above $2,400 with the immediate reaction to reports of Israel striking Iran. Meanwhile, the pullback seen in the US Treasury bond yields helps XAU/USD hold its ground.
Bitcoin Weekly Forecast: BTC post-halving rally could be partially priced in Premium

Bitcoin price shows no signs of directional bias while it holds above $60,000. The fourth BTC halving is partially priced in, according to Deutsche Bank’s research.
Week ahead – US GDP and BoJ decision on top of next week’s agenda

US GDP, core PCE and PMIs the next tests for the Dollar. Investors await BoJ for guidance about next rate hike. EU and UK PMIs, as well as Australian CPIs also on tap.