On Wednesday, crude oil lost 1.48% as the reported resumption of Libyan crude production and the EIA weekly report on U.S. inventories weighed on the price. As a result, light crude hit its lowest level since June 5 and dropped below the next downside target. Does it mean that oil bulls lost ground?
Yesterday, crude oil started the session lower after Libya announced the resumption of operations at its main oil fields. However, the price decline accelerated after official weekly U.S. oil inventories data reflected a number of bearish factors. Although the U.S. Energy Information Administration reported that U.S. crude oil supplies declined by 2.4 million barrels in the week ended July 4, beating expectations for a decline of 2.2 million barrels, the report also showed a 600,000-barrel increase in the amount of refined motor gasoline in storage during a week when inventories were expected to fall in response to strong holiday driving demand. As a result, light crude hit a 5-week low of $101.85. Will the commodity drop any further from here? Let’s check what can we infer from the charts (charts courtesy of http://stockcharts.com).
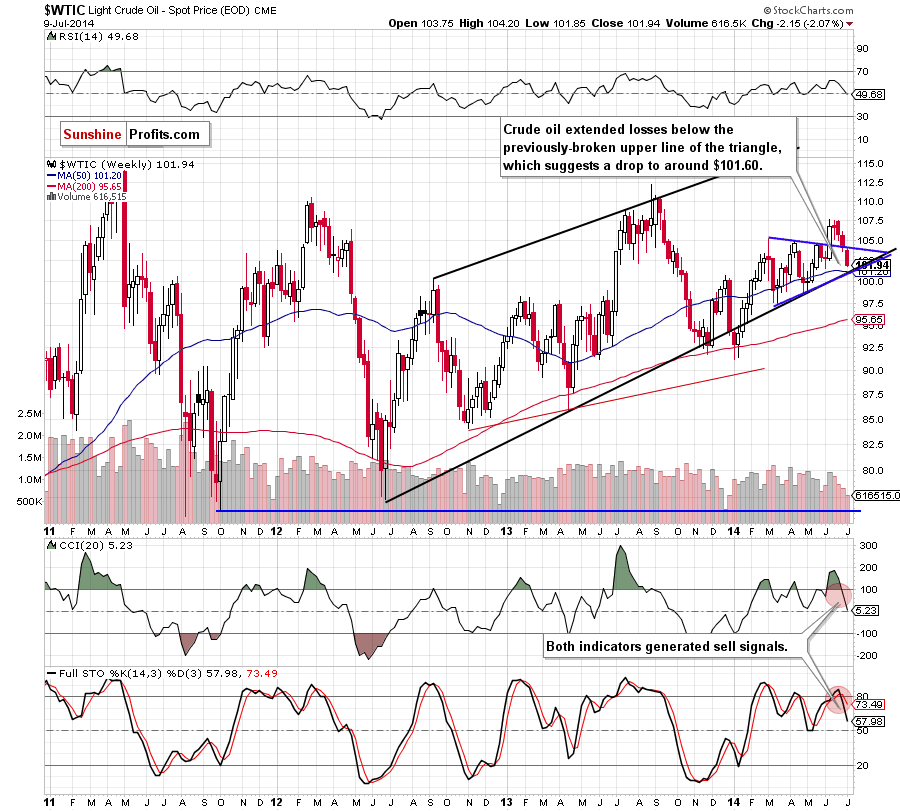
The medium-term outlook has deteriorated slightly as crude oil still extended losses and moved away from the upper line of the blue triangle. Taking this fact into account and combining it with the current position of the indicators, which still favors oil bears, we are convinced that our last commentary is still up-to-date:
(…) crude oil will extend the current correction and the initial downside target will be around $101.60, where the June low is. At this point it’s worth noting that slightly below this level is a strong support zone created by the 50-week moving average (currently at $101.26) and the lower line of the trend channel (and lower border of the blue triangle), which may pause further deterioraion.
Now, let’s check if the short-time outlook is the same.
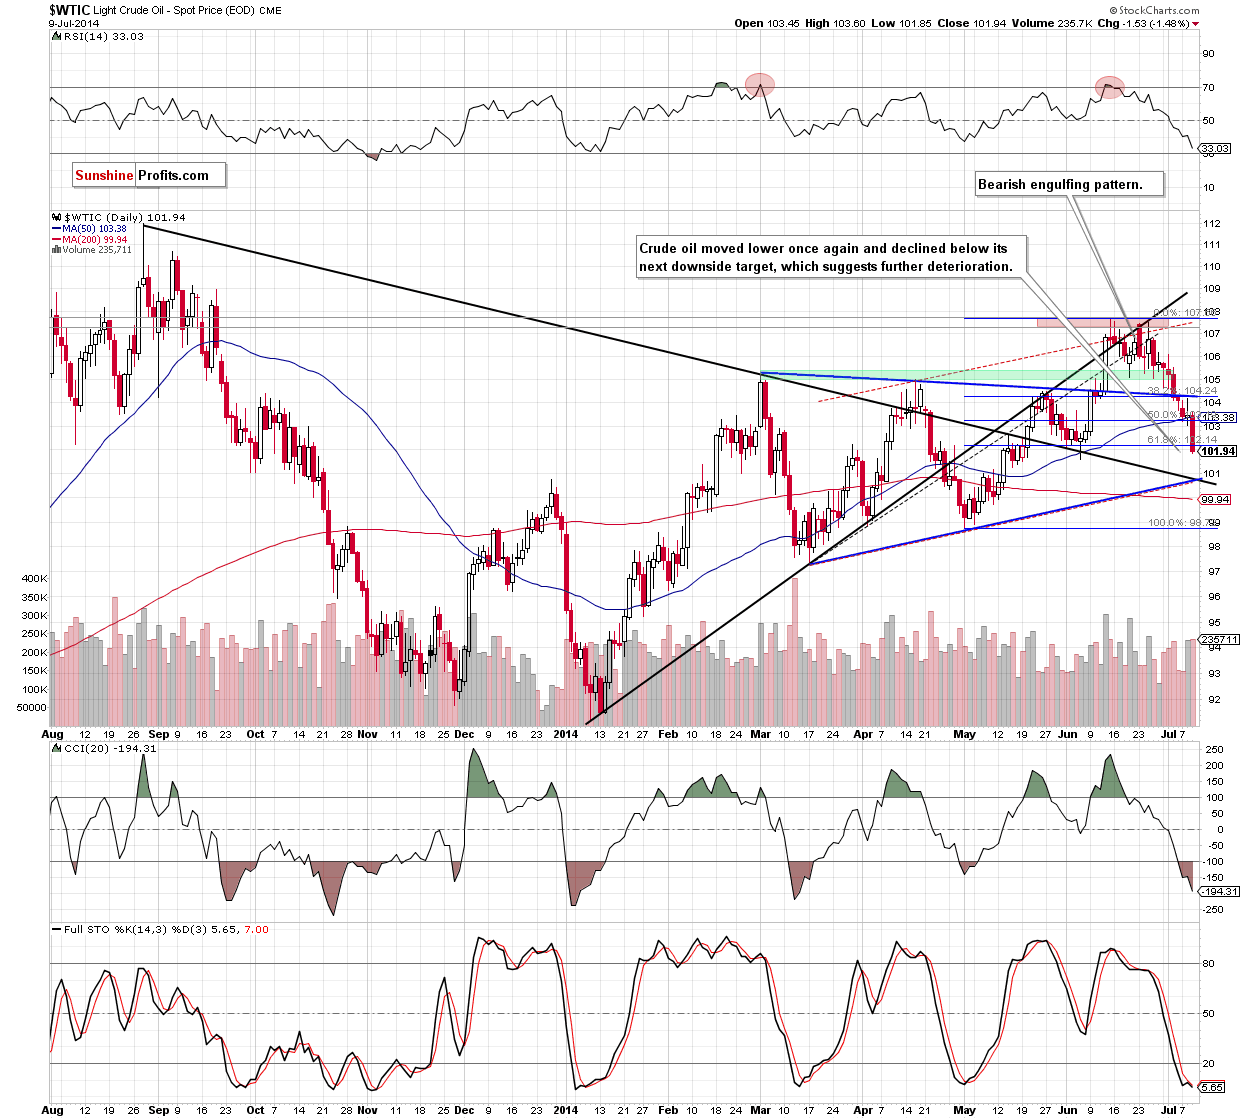
(…) if oil bulls fail, we’ll see another attempt to break below the support zone. If it happens, the next downside target will be around $102.14, where the 61.8% Fibonacci retracement is. Please keep in mind that sell signals generated by the indicators remain in place, supporting the bearish case at the moment.
Looking at the above chart, we see that oil bears’ attack on the support zone has been very effective. As a result, they not only realized the above-mentioned scenario, but also pushed the commodity below its nearest support. In this way, oil bulls lost their chance for a corrective upswing and invalidation of the breakdown below the medium-term blue resistance line (at least in the short term). What does it mean for crude oil? In our opinion, the very short-term technical situation has changed from bearish to even more bearish as Tuesday’s upswing was nothing more than a verification of the breakdown. Therefore, it’s doubtful to us that we’ll see a rebound before a drop to (at least) $101.60, where the June low and the medium-term downside targets are. Please remember that you should keep an eye on the commodity in this area, because, as we have pointed out before, this support zone may pause further deterioration.
Summing up, the very short-term situation has deteriorated significantly as crude oil declined not only below the 50% Fibonacci retracement and the 50-day moving average, but also below the next downside target. Additionally, the breakdown below the blue medium-term support/resistance line was verified, which together suggests further deterioration. In this environment, we remain bearish and wait for lower values of crude oil, which are still ahead us. Therefore, short positions, opened on June 17 around $106.50, are more profitable after yesterday’s decline and still justified from the risk/reward perspective.
Very short-term outlook: bearish
Short-term outlook: mixed with bearish bias
MT outlook: mixed
LT outlook: mixed
Trading position (short-term; our opinion): Short. Stop-loss order at $109.20.
All essays, research and information found above represent analyses and opinions of Przemyslaw Radomski, CFA and Sunshine Profits' employees and associates only. As such, it may prove wrong and be a subject to change without notice. Opinions and analyses were based on data available to authors of respective essays at the time of writing. Although the information provided above is based on careful research and sources that are believed to be accurate, Przemyslaw Radomski, CFA and his associates do not guarantee the accuracy or thoroughness of the data or information reported. The opinions published above are neither an offer nor a recommendation to purchase or sell any securities. Mr. Radomski is not a Registered Securities Advisor. By reading Przemyslaw Radomski's, CFA reports you fully agree that he will not be held responsible or liable for any decisions you make regarding any information provided in these reports. Investing, trading and speculation in any financial markets may involve high risk of loss. Przemyslaw Radomski, CFA, Sunshine Profits' employees and affiliates as well as members of their families may have a short or long position in any securities, including those mentioned in any of the reports or essays, and may make additional purchases and/or sales of those securities without notice.
Recommended Content
Editors’ Picks
EUR/USD rises toward 1.0700 after Germany and EU PMI data

EUR/USD gains traction and rises toward 1.0700 in the European session on Monday. HCOB Composite PMI data from Germany and the Eurozone came in better than expected, providing a boost to the Euro. Focus shifts US PMI readings.
GBP/USD holds above 1.2350 after UK PMIs

GBP/USD clings to modest daily gains above 1.2350 in the European session on Tuesday. The data from the UK showed that the private sector continued to grow at an accelerating pace in April, helping Pound Sterling gather strength.
Gold price flirts with $2,300 amid receding safe-haven demand, reduced Fed rate cut bets

Gold price (XAU/USD) remains under heavy selling pressure for the second straight day on Tuesday and languishes near its lowest level in over two weeks, around the $2,300 mark heading into the European session.
Here’s why Ondo price hit new ATH amid bearish market outlook Premium

Ondo price shows no signs of slowing down after setting up an all-time high (ATH) at $1.05 on March 31. This development is likely to be followed by a correction and ATH but not necessarily in that order.
US S&P Global PMIs Preview: Economic expansion set to keep momentum in April

S&P Global Manufacturing PMI and Services PMI are both expected to come in at 52 in April’s flash estimate, highlighting an ongoing expansion in the private sector’s economic activity.

