Highlights
- Market movers: Weekly technical outlook
- What the January NFP report means for Fed policy
- Look ahead: Stocks
- Look ahead: Commodities
- Global data highlights
Market movers: Weekly technical outlook
Technical Developments:
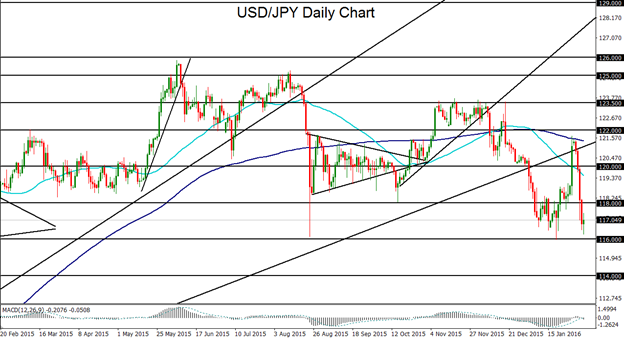
- USD/JPY has sharply reversed its recent gains and continues to be vulnerable to a falling dollar and volatility in the equity markets. Technical bias: Neutral to Moderately Bearish
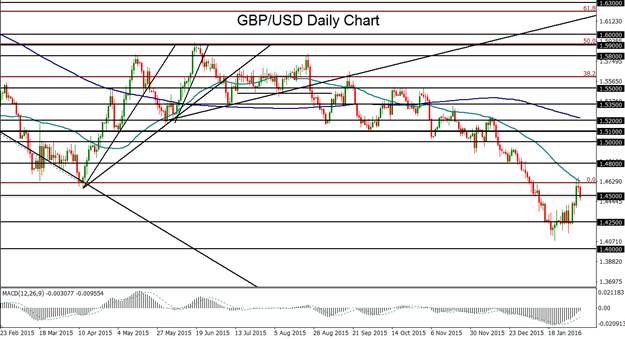
- GBP/USD has rallied to form an upside pullback within its strong bearish trend, but could be starting to lose its upside momentum. Technical bias: Moderately Bearish
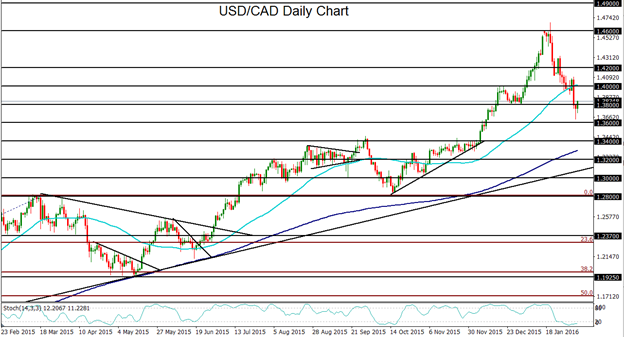
- USD/CAD has extended its sharp pullback, but would be dependent on an extended recovery in crude oil prices in order to drop significantly further. Technical bias: Neutral to Moderately Bullish
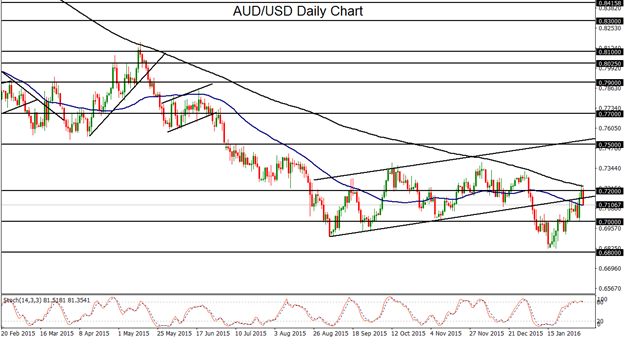
- AUD/USD has broken out above its head-and-shoulders bottoming pattern and could be on track for a further relief rally on a weakened US dollar. Technical bias: Moderately Bullish
During much of the past week, the US dollar suffered some of its worst losses in years. This was largely due to sharply diminished expectations of further Fed rate hikes this year, as lackluster economic data and highly volatile financial markets have begun to weigh heavily on the Federal Reserve’s interest rate aims. Friday’s non-farm payrolls report for January came out much lower than expected at 151,000 jobs added against prior expectations of 190,000, though the unemployment rate dipped down to 4.9% and average hourly earnings grew by more than expected. The dollar rebounded on this report due to the positives in unemployment and wage growth, despite the sizable miss in non-farm payrolls. For USD/JPY, this past week’s plunge in the US dollar and increased volatility in the stock markets prompted the currency pair to reverse all of its gains from the prior week, when the Bank of Japan cut interest rates into negative territory. This USD/JPY reversal has been both swift and severe, bringing the currency pair back down to re-approach major support around the 116.00 level. Despite the Bank of Japan’s negative interest rate move, lowered Fed hike expectations and heightened stock market volatility have lately appeared to be the main drivers of USD/JPY movement, pushing its exchange rate down towards the lows of its recent trading range. With further dollar weakness, any breakdown below the 116.00 level could begin to target key support around 114.00. Upside resistance after the recent plunge currently resides around the 118.00 level.
GBP/USD
GBP/USD has spent much of the past week rising and continuing its upside pullback within the context of its longer-term downtrend. This rally pushed the currency pair back up to hit key resistance around the 1.4600 level, which is also near where the 50-day moving average is currently situated. After Friday’s US employment data, a dollar rebound prompted GBP/USD to fall from resistance. Could this retreat signal an impending end to the currency pair’s recent upside pullback? With any further downside momentum and sustained trading below the 1.4500 level, a continuation of GBP/USD’s entrenched bearish momentum could prompt a further drop to begin targeting the 1.4250 and then 1.4000 support objectives once again.
USD/CAD
USD/CAD has been in a general decline for the past few weeks as the US dollar has stumbled and crude oil prices have shown slightly more stability on lingering hopes that a deal to cut crude output by major oil-producing nations might at least be in the very preliminary stages. The pullback for USD/CAD has now extended for nearly three weeks, pushing the previously surging currency pair down to seven-week lows below 1.3800 support. Whether this pullback continues or reverses hinges largely on both the market’s ever-shifting view of future Fed rate hikes as well as the rather remote possibility for a crude oil output deal. Any further US dollar weakness should also give a boost to crude oil, whether or not an output deal is reached. In the event of this further weakness in the US dollar, USD/CAD could continue its pullback if it sustains trading below the noted 1.3800 level. In this case, major downside support resides around the 1.3400 level. On any USD/CAD rebound, especially if crude oil continues its entrenched bearish trend, a major upside resistance objective continues to reside around the 1.4000 psychological level.
AUD/USD
AUD/USD has continued its rebound from multi-year lows, having just reached up to the key 0.7200 resistance level and the 200-day moving average before retreating after the US employment data was released on Friday. Prior to the current rebound, AUD/USD had formed a small, inverted head-and-shoulders pattern near its multi-year lows. This bullish head-and-shoulders pattern that had been developing since the beginning of the year has given AUD/USD bulls cause for some optimism that a bottom may have formed for the embattled currency pair as it consolidated near recent long-term lows. Having broken out above the pattern, AUD/USD could be poised for further gains, especially if the US dollar continues to weaken. A breakout above the 0.7200 resistance level and the 200-day moving average could provide the technical impetus for a further recovery. In that event, a key upside target is around the 0.7400 resistance level. This bullish recovery would be invalidated, however, on any return back down below the 0.7000 psychological level.
What the January NFP report means for Fed policy
As the monthly tradition dictates, traders eagerly awaited today’s US jobs report with the (lack of) patience of a kid on Christmas. When the report was finally unveiled, it was by no means the anticipated “Red Ryder Carbine Action 200-shot Range Model air rifle with a compass in the stock and ‘this thing which tells time‘(a sundial)” that Ralphie Parker desperately wanted in the classic 1983 film “A Christmas Story,” but it’s hardly as disappointing as some have made it out to be.
Overall, the US economy created 151k jobs in January, below the consensus estimate of 190k jobs, and roughly in line with our model’s 160k estimate. The revisions did little to take the edge off the disappointing number of jobs created, with a net subtraction of -2k jobs from the previous two months’ reports.
While the overall quantity of jobs was certainly a disappointment relative to some traders’ expectations, the quality of these jobs was much stronger than we’ve seen of late. Specifically, the average hourly earnings figure rose 0.5% m/m, above the 0.3% rise expected and the highest month-over-month wage increase we’ve seen since 2006! On a year-over-year basis, wages rose 2.5%, well exceeding the rate of inflation. We also saw average weekly hours edge upward to 34.6 hours from 34.5 last month.
In fact, some have argued that today’s employment report is the first sign that the massive “slack” in the labor market is finally dissipating. In other words, we should expect job creation to downshift slightly and wages to rise sharply in a “tight” labor market. We don’t necessarily want to read too much into a single month’s jobs report (especially when last month’s release showed the exact opposite situation – high job growth and low wage growth), but it definitely bears watching as we move through H1 2016.
In terms of Federal Reserve policy, today’s report is unlikely to tip the scales meaningfully. Despite the most recent “dot chart,” we believe that a rate hike in the March FOMC meeting is highly improbable given the ongoing market turmoil and concerns about slowing global growth. At a minimum, it suggests that the Fed Funds futures market’s implied forecast of zero rate hikes at all this year may still be proven overly pessimistic.
Market Reaction
In handicapping the market’s reaction to any big release, it’s critical to consider the recent context. In this case, the US dollar was in the midst of its worst week in years and was deeply oversold on a short-term basis. Therefore, dollar bears were looking for any reason to take profits ahead of the weekend, and because today’s jobs report wasn’t unanimously awful, we’re seeing a bit of a bounceback in the world’s reserve currency. After briefly spiking to nearly 1.1250, EUR/USD is now trading down around 100 pips to 1.1125, while USD/JPY is also tacking on around 100 pips from its low to 117.30.
The reaction in other markets is more nuanced. On the commodities front, both oil and gold have taken a turn for the worse based on the dollar’s strength. Meanwhile, the yield on the benchmark 10-year treasury bond is rising to 1.89% as we go to press. Whether these moves continue into next week remains to be seen, but it’s clear that today’s jobs report was not as bad as it appeared at first glance.
Look ahead: Stocks
The US stock markets have been trying to stabilize in recent times following the wobble at the start of the year, but so far with little success. Concerns over the global economy are still there and as such traders are not showing much enthusiasm to buy stocks even if government bond yields are at historically low levels. The world’s major central banks have either expanded their unconventional policy tools further, promised to do so or, in the case of the Fed and BoE, dropped their previously hawkish stance. The fourth quarter US earnings results have been poor, with the exception of a few names such as Facebook. So we are not out of the woods yet. But there is a possibility for a short-term recovery from these depressed levels. At least that’s what the charts are pointing to, anyway.
More on that below, but the rebounding prices of oil and metals have provided some support to commodity stocks recently. With regards to oil, there is lots of uncertainty still hanging over the market and traders are getting used to wild daily price swings in and around the $30 area. Essentially, we have seen tentative signs that the buyers are stepping back in but because there has been no confirmation of a change in the trend yet, they are rightly being nimble. And it is pretty much a similar story for the stock markets – lots of choppy price action as both the bulls and bears battle for control, but there’s still no clear winner.
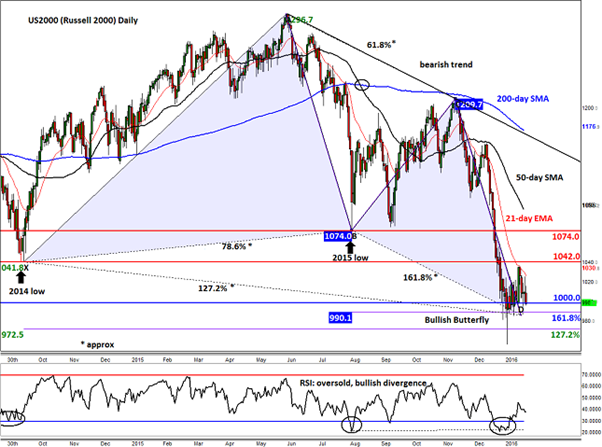
But as can be seen from the daily chart of the Russell 2000, below, even small-cap US stocks are trying to regain their poise. The index is attempting to find a base around the psychologically-important 1000 level; here it has formed several bullish-looking candlestick formations in recent days, but as mentioned with very little follow-through in the buying pressure. The convergence of two Fibonacci extension levels from as many price swings around the point D of an ABCD price pattern means there’s also a bullish Butterfly formation in the making around these levels. This, combined with the RSI’s bullish divergence with the index is suggesting that at the very least the index is due for an oversold bounce – if we haven’t already seen one, that is. It is not a good sign that the RSI has recovered from oversold conditions but the underlying Russell index hasn’t.
If the Russell does manage to bounce, it will still need to clear some important resistance levels that are now looming large at 1040/2 and then the 1074/5 area. These are the respective low points from 2014 and 2015. Bullish traders should therefore remain nimble. Indeed, it could be that some speculators may well be waiting to sell once the markets stage a more profound recovery, now that the longer-term technical outlook is clearly bearish. But if the market falls further without even staging a small recovery, this would be a very bearish sign. In any event, a potential closing break below the 161.8% extension level of the BC swing at 990 would be a bearish development. If this were to happen, we could see some further sharp drops before the buyers try to make another attempt at forming a base.
Look ahead: Commodities
Gold’s 10 percent rally since early December has certainly been impressive, but not a surprise given the ongoing stock market turmoil and dollar weakness. The precious metal obviously pays no interest or dividends, and costs money to store. But then again with the central bank currency war being at full throttle, yields are universally low or come with undesirably high risks. Given the current level of investor pessimism about the global economy, investors are unsurprisingly not showing much enthusiasm about riskier assets like stocks. Consequently, they appear to be moving back into cash or the perceived safe haven assets such as gold and silver. This is reflected in the strong inflows into gold ETFs. According to Bloomberg data, an additional 4.8 tons of gold were added yesterday, bringing the total ETF inflows since the start of the year to a solid 86 tons. If ETF inflows continue at this pace, the price of gold could extend its gains sharply in the coming weeks. The physical demand for gold is also likely to have risen due to jewelry purchases ahead of the Chinese New Year celebrations, which starts on Monday.
But jewelry demand could be more subdued after the Chinese New Year, and there’s also potential for significant profit-taking from ETF speculators. Indeed, gold’s good run of form could easily reverse and on Friday it did wobble slightly on the back of a mixed-bag US jobs report. The dollar strengthened slightly as investors cheered news of the strong 0.5% increase in wages and also the unexpected drop in unemployment rate. This offset the lower jobs growth, which was mostly priced in. But it remains to be seen whether the dollar could stage a significant comeback. Unfortunately, the economic calendar is fairly light for most of next week, while Chinese investors will be away to celebrate the New Year there. So, there will be less economic stimulus to provide direction for the dollar and gold.
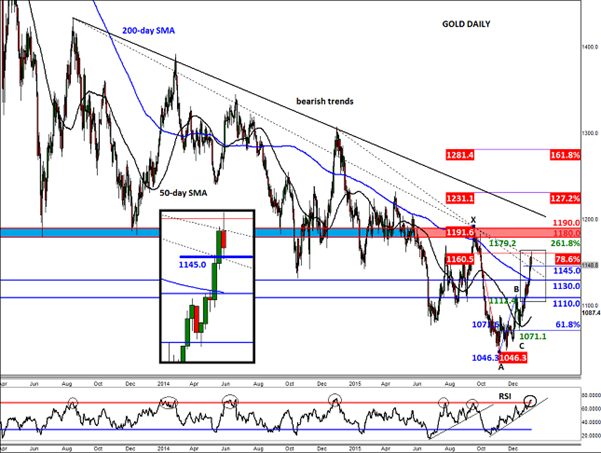
From a technical perspective, gold’s break above the 200-day moving average at $1130 is a bullish outcome. It is important that the metal now holds above here. In the past couple of times when gold attempted to rise above this moving average, there was very little follow-up in buying momentum. If it holds here longer this time, it would suggest that we could be in the process of a much larger recovery. But, as the metal is still below a long-term bearish trend, one should proceed with caution as the run could potentially end soon or at least pause for breath, particularly because the Relative Strength Index (RSI) is once again at the ‘overbought’ threshold of 70 and above. Traders should watch their resistance levels carefully now. The immediate potential hurdles could be the 78.6% Fibonacci retracement level of the last significant downswing, at $1160, followed by the 261.8% extension level of the last mini correction at just shy of $1180, with the latter also being a pivotal level on larger time frames. Thereafter, there is not much further resistance until the $1190/92 area – the October 2015 high. Watch for a potential false break or double top reversal pattern to emerge around this area, should we get there. Otherwise, gold may make a run towards the long-term bear trend around $1200 and potentially higher. The previous resistances such as $1145 and $1130 could be the new potential support levels to watch. The bias would turn back bearish if the metal breaks below the 200-day average.
Global Data Highlights
Monday, February 8
No major data releases scheduled.
Tuesday, February 9
0:30 GMT – AU NAB Business Confidence
It’s a bit of a slow start to the week for global FX traders, but this report out of Australia should give some insight into how businesses are adapting to the country’s new economic environment. This diffusion index has printed in positive territory every month since mid-2013, but with commodities subdued and China slowing down, there’s a risk we could see the first decline in two and a half years.
23:30 GMT – AU Westpac Consumer Sentiment
In contrast to business sentiment, consumer sentiment Down Under has been much more volatile. This report shows the level of financial confidence among AU consumers, which tends to be a leading indicator for consumer spending. For the same reasons as the Business Confidence survey, there’s a risk we could see a negative reading here as well.
Wednesday, February 10
9:30 GMT – UK Manufacturing Production
Much like in the US, manufacturing activity in the UK has been in the dumps for several months now. The last two Manufacturing Production reports declined 0.4% on a month-over-month basis, though after last week’s better-than-anticipated reading in UK Manufacturing PMI (52.9 vs. 51.8 eyed), there’s a chance we could see a modest expansion here.
15:00 GMT – US Fed Chair Yellen Testimony (Day 1)
In her semi-annual “Humphrey-Hawkins testimony to Congress (House of Representatives on Wednesday, Senate on Thursday), Janet Yellen will lay out the FOMC’s view on the economy and current stance of monetary policy before answering questions from the legislators. Expect plenty of political posturing and a dovish stance from the Fed’s head, given both the recent economic slowdown and audience’s (Congress’) general desire for perpetually simulative policy.
Thursday, February 11
15:00 GMT – US Fed Chair Yellen Testimony (Day 2)
See above.
22:30 GMT – RBA Governor Stevens Testimony
RBA Governor Stevens will take the stand for his own grilling by lawmakers shortly after Yellen. With all major central banks growing more dovish of late, a conservative assessment of the AU economy is likely. Watch for comments that suggest the RBA is paving the way for a potential interest rate cut later this year; if seen, this could drive the Aussie lower.
Friday, February 12
10:00 GMT - Eurozone Flash GDP (Q4)
We finally get some traditional top-tier economic data on Friday, when the Eurozone releases its Q4 Flash GDP reading. Traders and analysts estimate that the Eurozone economy grew by 0.3% q/q, in-line with the 3rd quarter growth rate. It’s worth noting that although the Eurozone is still struggling to generate any meaningful inflation, other economic data was relatively decent throughout Q4, so there’s a chance of a stronger-than-expected reading.
13:30 GMT – US Retail Sales (Jan)
The December Retail Sales report was a bit of a disappointment for the world’s largest economy; retail sales actually contracted -0.1% on a month-over-month basis in the critical holiday shopping period. Taking a longer-term view, we haven’t seen a US retail sales report come out above economists’ expectations since all the way back in June, and before that the last “beat” was in December 2014. We’ll see if that trend of disappointing readings continues this month.
15:00 GMT – US U. of M. Consumer Sentiment
A variety of factors impact US consumer sentiment, but gas prices and jobs are probably the biggest ones. Given the short-term uptick in oil prices and slightly weaker-than-anticipated January jobs report, another reading in the lower 90s seems likely for this key leading indicator.
This research is for informational purposes and should not be construed as personal advice. Trading any financial market involves risk. Trading on leverage involves risk of losses greater than deposits.
Recommended Content
Editors’ Picks
AUD/USD risks a deeper drop in the short term

AUD/USD rapidly left behind Wednesday’s decent advance and resumed its downward trend on the back of the intense buying pressure in the greenback, while mixed results from the domestic labour market report failed to lend support to AUD.
EUR/USD leaves the door open to a decline to 1.0600

A decent comeback in the Greenback lured sellers back into the market, motivating EUR/USD to give away the earlier advance to weekly tops around 1.0690 and shift its attention to a potential revisit of the 1.0600 neighbourhood instead.
Gold is closely monitoring geopolitics

Gold trades in positive territory above $2,380 on Thursday. Although the benchmark 10-year US Treasury bond yield holds steady following upbeat US data, XAU/USD continues to stretch higher on growing fears over a deepening conflict in the Middle East.
Bitcoin price shows strength as IMF attests to spread and intensity of BTC transactions ahead of halving

Bitcoin (BTC) price is borderline strong and weak with the brunt of the weakness being felt by altcoins. Regarding strength, it continues to close above the $60,000 threshold for seven weeks in a row.
Is the Biden administration trying to destroy the Dollar?

Confidence in Western financial markets has already been shaken enough by the 20% devaluation of the dollar over the last few years. But now the European Commission wants to hand Ukraine $300 billion seized from Russia.
