Highlights
- Market Movers: Weekly Technical Outlook
- NZD/USD: Are bulls coming to the rescue?
- Look Ahead: Stocks
- Look Ahead: Commodities
- Global Data Highlights
Market Movers: Weekly Technical Outlook
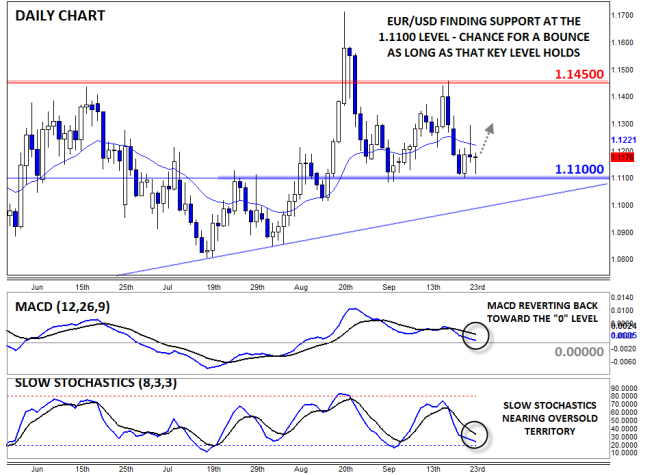
Technical Developments to Watch:- EUR/USD holding key support at 1.1100
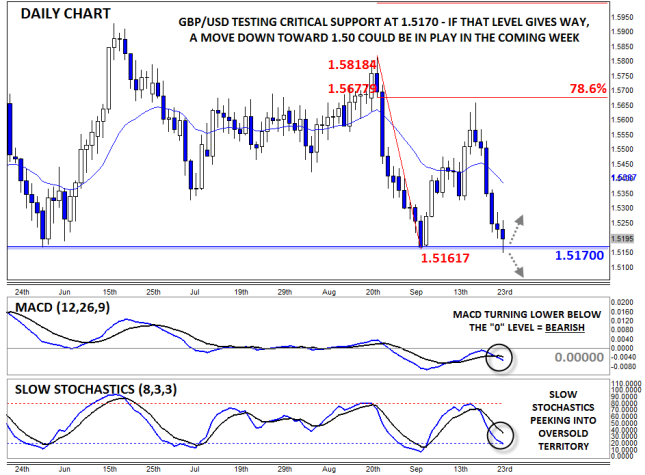
- GBP/USD testing critical previous lows around 1.5170 – a break could target 1.50
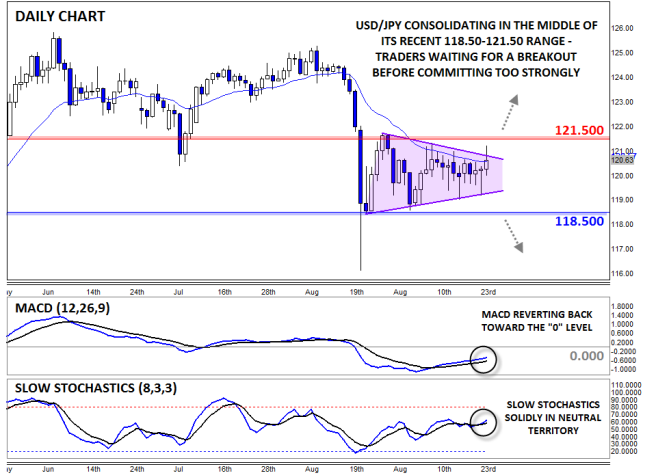
- USD/JPY remains rangebound between 118.50 and 121.50
- AUD/USD in play, traders may continue to fade near-term bounces this week
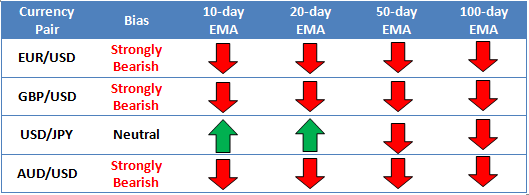
* Bias determined by the relationship between price and various EMAs. The following system determines bias (numbers represent how many EMAs the price closed the week above): 0 = Strongly Bearish, 1 = Slightly Bearish, 2 = Neutral, 3 = Slightly Bullish, 4 = Strongly Bullish.
** All data and comments in this report as of Friday afternoon **
EUR/USD

- EUR/USD bounced off previous support near 1.1100 last week, before fading into the weekend
- MACD is reverting back toward the “0” level
- Near-term range emerging between 1.11 and 1.1450
Source: FOREX.com
GBP/USD

- GBP/USD reversed sharply to fall nearly 300 pips last week
- MACD trending lower below its signal line and the “0” level, signaling bearish momentum
- Bulls need to defend major medium-term support at 1.5170
Source: FOREX.com
USD/JPY

- USD/JPY chopped around last week before edging higher late in the week
- MACD edging higher but still well below the “0” level
- Traders continue to monitor the current 118.50-121.50 range for a potential breakout
Source: FOREX.com
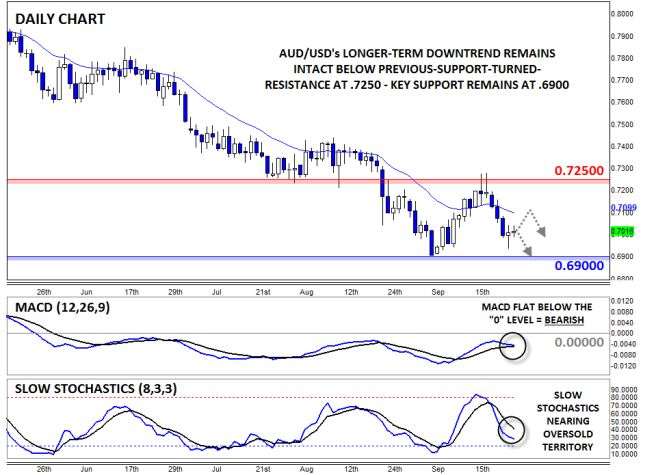
AUD/USD

- AUD/USD topped out at previous support at .7250 last week
- MACD and Slow Stochastics show balanced, two-way trade
- Longer-term downtrend remains intact below the key .7250 level
Source: FOREX.com
NZD/USD: Are bulls coming to the rescue?
The diverging monetary policy objectives of New Zealand and the US have made NZD/USD an easy target recently, with the pair hovering around its lowest level in over six years. The kiwi’s once strong fundamental supports have almost completely eroded alongside NZ’s monetary policy outlook and rising fears about the health of the global economy. At the same time, the US dollar has benefited from the prospect of monetary policy tightening from the Fed and increased safe haven flows amidst a risk-off tone in the market.Why do bears love the kiwi?
Deteriorating domestic economic conditions, falling commodity prices and increased concern about the health of China’s all-important economy swamped the NZ dollar in late 2014 and for most of this year. Dairy prices were falling at auction consistently and domestic economic data took a turn for the worst, leading the RBNZ to aggressively ease monetary policy, cutting the OCR at three consecutive meetings by a total of 75bps.
The RBNZ is also widely expected to lob another 25bps off the OCR at its next meeting in October due to softer-than-expected Q2 growth figures and a still weak inflation outlook, but we aren’t expecting further easing beyond this. Dairy prices are rebounding and the domestic economy is showing signs of life, with manufacturing sentiment picking up in August alongside a still strong housing market. This may be enough to push the RBNZ into neutral later this year, assuming domestic economic data plays along until then.
The US dollar side of the equation
The US dollar is still king, and moves in the world’s number one reserve currency can dominate the FX market. At present, the market is juggling the idea of tighter monetary policy in the US, with expectations constantly changing due to concerns about the health of the global economy. Nonetheless, at the end of last week Fed Chair Yellen reiterated that there’s a case for tighter monetary policy this year. She noted that recent developments in the global economy are not expected to have a significant impact on the path of US interest rates, but this may just been seen as the Fed covering all of its bases by keeping the door open for a hike this year.
What does this mean for NZD/USD?
There are still significant fundamental headwinds facing NZD/USD, largely due the prospect of a tighter NZ/US interest rate spread as US rates rise and the OCR in NZ continues to sink. But this is largely priced into the market already, which presents some opportunity for NZDUSD strength in the medium term if NZ’s economy continues to improve. The question is, are bulls game enough to challenge bears amidst the risk-off tone in the marketplace?
Look ahead: Stocks
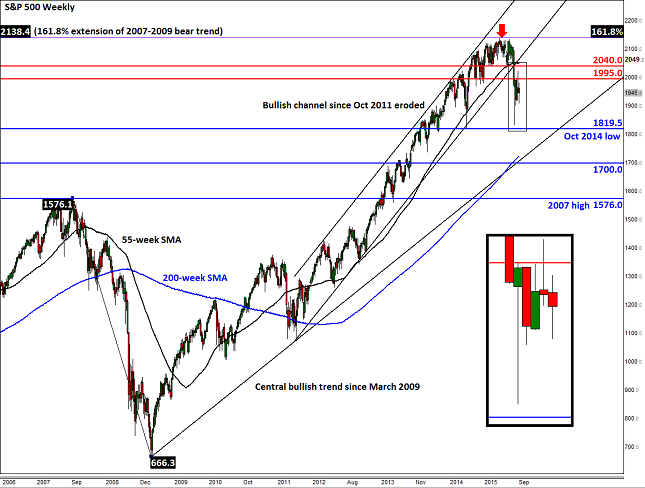
Another volatile week is about to end for the global equity markets. Concerns about the health of the Chinese economy was a dominant theme this week, while individual company news such as Volkswagen’s emission scandal weighed heavily in some European markets, most notably the German DAX index. Next week’s economic calendar looks jam-packed, so expect the stock market volatility to remain elevated. Among the highlights will be the official Chinese manufacturing PMI on Wednesday and the US monthly jobs report on Friday. In addition, several Federal Reserve officials will be speaking next week, including Chairwoman Janet Yellen on Wednesday. For stocks to maintain their gains made at the end of this week, we will need to hear some good news, in particular on the Chinese economy. If the US numbers also generally beat the expectations, then the probability of a 2015 rate hike would increase. Although some would argue that this would not be a good outcome for the markets, the potentially stronger data may give some investors the confidence they need in order to come back into the markets following this recent correction. On the other hand, if the economic data show more negative surprises next week, then risk assets could get hit hard once again.Despite Friday’s rally, the technical outlook on the major US indices, such as the S&P 500, remain bearish. As can be seen from the weekly chart of the S&P, the multi-year rally has evidently peaked this year around an exhaustion area of 2135/40, which corresponds with the 161.8% Fibonacci extension level of the entire 2007-2009 bear trend. After climbing to this area, the index has gone on to break outside of a strong long-term bullish channel and below its 55-week moving average, before dropping sharply in the middle of last month, followed by a period of stabilization that has lasted for about a month now.
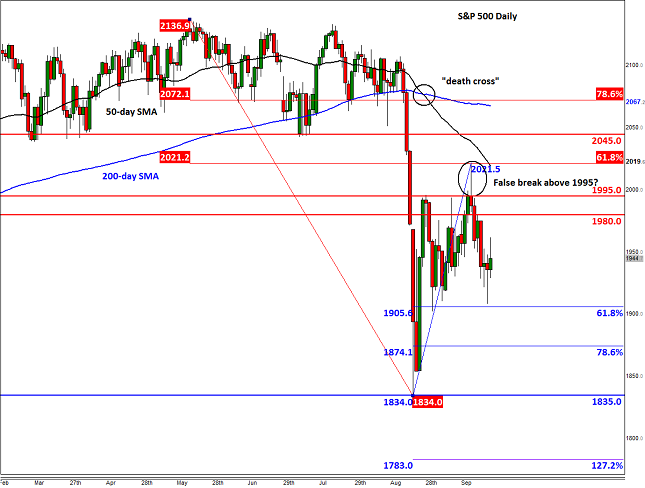
Last week saw the index momentarily break through the key 1995 resistance level. But the bulls were unable to hold their ground there for long because the rally quickly ran out of steam at the 61.8% Fibonacci retracement level (2021) of the move down from the record high (see the daily chart). The resulting sell-off created an inverted hammer candlestick on the weekly chart of the S&P, a technical pattern which correctly pointed to further weakness for this week.
Although at this stage it is still too early to say whether the markets have peaked, the technical evidence in front of us suggests this may well be the case. And the fact that the most recent recovery failed to materialize into a strong rally, the probabilities of another leg lower have correspondingly increased.
Looking at the daily chart and it is obvious that the sellers were anticipating a bounce back around the 61.8% Fibonacci level of the upward move from the August low, at 1905. Evidently, they took profit before the index reached this level on Thursday, leading to a short-covering rally heading into the weekend. Nevertheless the path of least resistance continues to remain to the downside and so we may see a break below this Fibonacci level early next week. The next bearish targets for next week include the 78.6% retracement level at 1874, followed by the August low at just below 1835 and then the October low at 1820.
Meanwhile on the upside, the key resistance levels for the S&P are at 1980, followed by the above-mentioned resistance level of 1995 and the 61.8% Fibonacci retracement at 2021. Until and unless the latter breaks, the near term technical outlook remains bearish for the S&P. If 2021 breaks, the index may go on to test the next resistance at 2045 or even the 78.6% Fibonacci level at 2072, before deciding on its next move.
Source: FOREX.com. Please note this product is not available to US traders.
Source: FOREX.com. Please note this product is not available to US traders.
Look ahead: Commodities
Gold sharply extended its gains for a second day on Thursday and more than made up the losses suffered earlier in the week. Though the metal was slightly lower at the time of this writing on Friday, it is still holding in the positive territory for the week and thus remains on course to post its second two-week rally since the second week of August. The metal’s upsurge in mid-week has coincided with a corresponding fall in the Dollar Index and increased volatility in the stock markets. But the US currency has managed to regain its poise after the Federal Reserve Chair Janet Yellen on Thursday night re-iterated that a rate increase is forthcoming in 2015, albeit with the added caveat that the FOMC’s view may change depending on the upcoming data releases. On that front, the third and final US GDP estimate, which was published on Friday, showed that the world’s largest economy actually grew more robustly than anticipated in the second quarter: 3.9% rather than 3.7% annualized growth.Though the dollar failed to move much in response to the better GDP reading, the greenback could be in for some increased volatility next week. Several Fed officials will be speaking in a data-packed week, including Janet Yellen herself on Wednesday. Undoubtedly, the biggest event of the week will be Friday’s US jobs report, which has shown consistent improvement over the past several months. Even so, the Fed still wants to see some further improvement in employment to be sure that the economy is on a sustainable path of recovery before hiking rates. They will also want to see signs of inflation which has been lacking thus far due mainly to the lower oil prices. But as the impact of oil prices wanes, and wage pressures grow, inflation could start to tick higher soon. If the market becomes more convinced as a result of improving US data that a rate increase is in fact imminent this year then the dollar may sharply extend its gains, as after all no other major central bank is anywhere near as hawkish as the Fed.
With the dollar potentially set to appreciate over the coming week and months, this bodes ill for some commodities that are priced in USD, such as gold and silver. That being said, both metals have recently managed to hold up relatively well despite the greenback’s renewed strength. Traders should be wary of not overestimating the dollar’s impact on gold. They need to realize that although the physical market tends to be overshadowed by the paper, there are actual underlying supply and demand forces in play. On that front, there’s been evidence of stronger Chinese demand of late, no doubt due to the “cheaper” prices. According to data from the Hong Kong government, China imported some 59.3 tons of the stuff in August and net imports were up for a second month to reach a three-month high. Gold imports from China could rise substantially from now until the Lunar New Year in early February which could support prices even more.
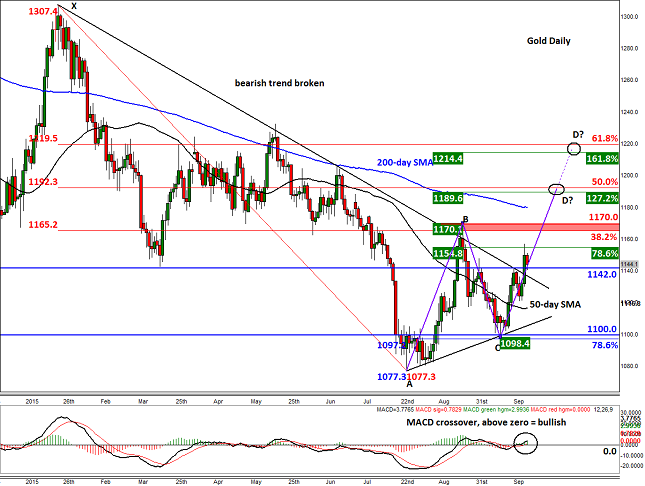
Meanwhile from a technical point of view, gold’s near-term outlook now looks bullish after it took out a 9-month-old bearish trend line following Thursday’s rally. The metal may extend its gains now if it manages to hold its own above the broken resistance level of $1140/2. If it does, the bulls may then aim for the following levels next:
$1165/70: previous resistance and 38.2% Fibonacci retracement of XA price swing
$1179/80: 200-day moving average
$1190/92: point D of an ABCD pattern, 127.2% Fibonacci extension of BC and 50% retracement of XA price swings
$1215/20: extended point D (1.618) of an ABCD pattern, 161.8% Fibonacci extension of BC and 61.8% Fibonacci retracement of XA price swing; in other words, a Bearish Gartley entry point
If, however, gold falls back below the abovementioned old resistance level of $1140/2, then this will raise some question marks over the breakout. Indeed, this could turn out to be a false break which would be a very bearish outcome. A break below support and this week’s low of $1120/1 would confirm this scenario, potentially leading to further follow-up technical selling next week.
 Source: FOREX.com. Please note this product is not available to US clients
Global Data Highlights
Monday, September 28No major data
Tuesday, September 29
1400GMT – US CB Consumer Confidence Index (September)
Following a fairly dismal reading from the University of Michigan Consumer Confidence Index for September (it dropped to its lowest level in a year at 85.7), investors aren’t expecting much from the “official” Consumer Confidence Index. It may support the theory that consumer confidence dropped in September as consumers become more pessimistic on the back of a soft global economic outlook. The market is expecting the index to drop to 96.0, from 101.5 in August.
Wednesday, September 30
0000GMT – NZ ANZ Business Confidence Index (September)
The deteriorating health of the NZ economy has hit business confidence hard which is casting doubt about the ability of the economy to overcome this big hump. In fact, it’s so bad that the RBNZ is in the midst of an aggressive easing cycle and is expected to lob another 25bps off the OCR in October.
0130GMT – Australian building approvals (August)
This is typically a minor release, but it’s still worth keeping an eye on given how volatile the Aussie has been lately. In August, building approvals are expected to fall 2% m/m, but they may still be up 7.4% y/y on the back of Australia’s booming housing market.
0830GMT – UK final GDP (Q2)
This may prove to be a non-event for the market, with investors expecting these figures to confirm what the market already knows, that the economy grew 0.7% q/q last quarter. Year-on-year growth is expected to slow to 2.6% in Q2, matching the preliminary figures. The big risk for GBP traders will be if economic growth slowed more than expected last quarter.
0900GMT – Eurozone flash CPI estimate (September)
This may only be an estimate, but it’s very closely watched by the market as it can be a good indicator of the pace of overall Eurozone inflation, or lack thereof in this case. We’re expecting the estimate to show a flat y/y pace of inflation in September.
Thursday, October 1
0100GMT – China Manufacturing PMI (September)
With the private sector reading of manufacturing PMI pushing 6+ year lows, the market is looking to the official index for some hope. However, the official index dropped into contraction territory in August and the outlook doesn’t look much better for September’s numbers, so traders should be on high alert in the lead up to this release and its sister release shortly thereafter.
0145GMT – China Caixin Manufacturing PMI (September)
The flash number was abysmal, amplifying concerns about the deteriorating health of China’s all-important economy. Another soft print could send risk assets globally into another tailspin and weigh heavily on overall risk appetite in the near-term. However, a rebound in activity would help to appease some fears about the manufacturing sector, although it would likely have to be backed up by a positive official manufacturing PMI number.
0830GMT – UK Manufacturing PMI (September)
A key indicator of activity in the manufacturing sector, Markit’s Manufacturing PMI, is expected to show a further deterioration of sentiment, with the index expected to drop to 51.3 from 51.5. It appears that a strong pound is hurting exporters which is, in turn, limiting activity in the manufacturing sector.
1400GMT – US ISM Manufacturing PMI (September)
With the economy under the microscope at the moment due the prospect of Fed tightening, every piece of economic data takes on extra significance. ISM’s Manufacturing PMI is arguably the most watched economic indicator for the all-important US manufacturing base, at least from a market perspective. In September, the index is expected to have remained stable in expansion territory at 53.0.
Friday, October 2
0130GMT – Australian retail sales (August)
The health of the Australian economy at the ground level is an important gauge of overall sentiment and economic activity. A sustained recovery in retail sales would help elevate fears about the inability of non-mining parts of the economy to pick up the slack being left behind by diminishing mining investment. This time around retail sales are expected to have jumped 0.4% m/m in August, after a 0.1% rise in the prior month.
1230GMT – US employment numbers (September)
The all-important NFP report is a major factor in the setting of monetary policy in the US, hence why it can be the most watched economic release in the world. The market is getting used to expecting a lot from these reports lately, with no one really questing that the US labor market is heading in the right direction. However, further wage growth is key to the overall health of the economy and the outlook for interest rates. In September, the headline making NFP figure is expected to be 200K and the unemployment rate is expected to remain at 5.1%.
This research is for informational purposes and should not be construed as personal advice. Trading any financial market involves risk. Trading on leverage involves risk of losses greater than deposits.
Recommended Content
Editors’ Picks
AUD/USD favours extra retracements in the short term

AUD/USD kept the negative stance well in place and briefly broke below the key 0.6400 support to clinch a new low for the year on the back of the strong dollar and mixed results from the Chinese docket.
EUR/USD now shifts its attention to 1.0500

The ongoing upward momentum of the Greenback prompted EUR/USD to lose more ground, hitting new lows for 2024 around 1.0600, driven by the significant divergence in monetary policy between the Fed and the ECB.
Gold aiming to re-conquer the $2,400 level

Gold stages a correction on Tuesday and fluctuates in negative territory near $2,370 following Monday's upsurge. The benchmark 10-year US Treasury bond yield continues to push higher above 4.6% and makes it difficult for XAU/USD to gain traction.
Bitcoin price defends $60K as whales hold onto their BTC despite market dip

Bitcoin (BTC) price still has traders and investors at the edge of their seats as it slides further away from its all-time high (ATH) of $73,777. Some call it a shakeout meant to dispel the weak hands, while others see it as a buying opportunity.
Friday's Silver selloff may have actually been great news for silver bulls!

Silver endured a significant selloff last Friday. Was this another step forward in the bull market? This may seem counterintuitive, but GoldMoney founder James Turk thinks it was a positive sign for silver bulls.