Highlights
- Market Movers: Weekly Technical Outlook
- The Yuan’s Wild Ride towards SDR Status
- Look Ahead: Stocks
- Look Ahead: Commodities
- Global Data Highlights
Market Movers: Weekly Technical Outlook
Technical Developments to Watch:
- EUR/USD coiling below key resistance at 1.1200 after a big short squeeze
- GBP/USD still consolidating between 1.5450 and 1.5675
- USD/JPY bias remains higher above 123.00 support
- USD/CAD in play, forming possible bullish flag pattern ahead of data-heavy week
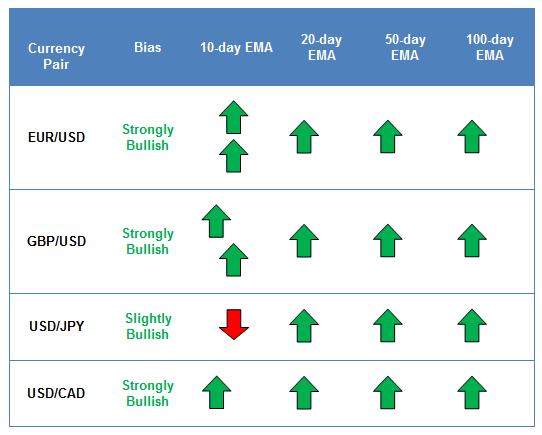
* Bias determined by the relationship between price and various EMAs. The following system determines bias (numbers represent how many EMAs the price closed the week above): 0 = Strongly Bearish, 1 = Slightly Bearish, 2 = Neutral, 3 = Slightly Bullish, 4 = Strongly Bullish.
** All data and comments in this report as of Friday afternoon **
EUR/USD
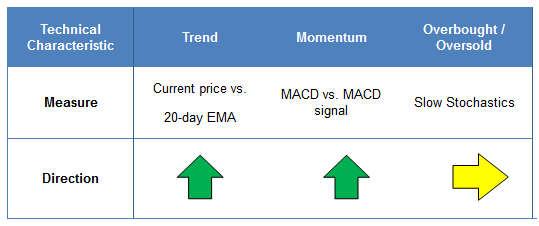
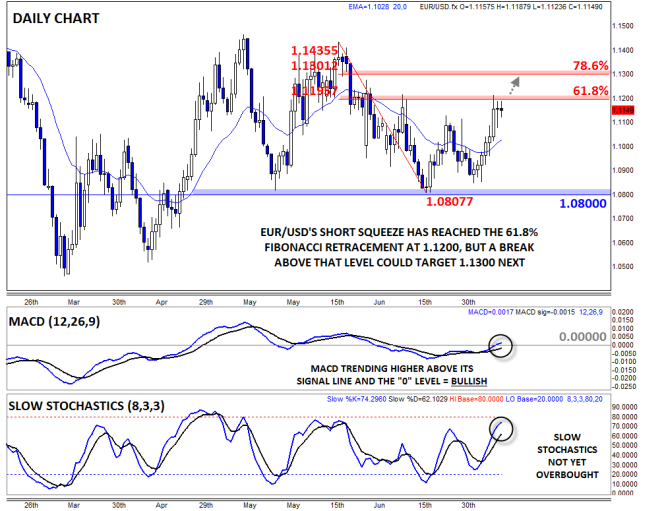
- EURUSD short squeeze stretched up to 1.1200 before pausing
- MACD showing a shift to bullish momentum
- A break through 1.1200 resistance could open the door for a continuation toward 1.13 next
EURUSD continued its short squeeze last week, breaking through previous resistance at 1.1130 on its way to reaching the 61.8% Fibonacci retracement at 1.1200 before pausing late in the week. The short squeeze has now stretched further than many traders expected, and with the MACD crossing above the “0” level and the Slow Stochastics not yet in overbought territory, the rally could extend further. A confirmed break above 1.1200 resistance could expose the 78.6% Fibonacci retracement at 1.1300 next.
Source: FOREX.com
GBP/USD
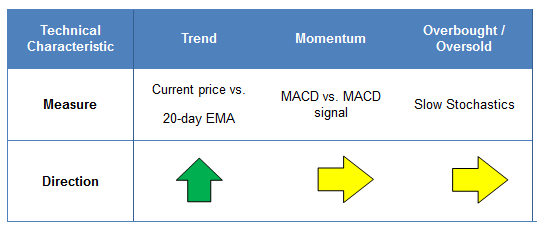
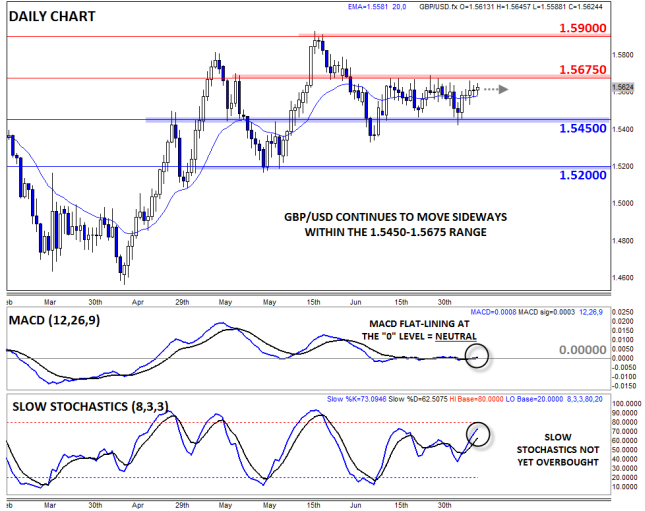
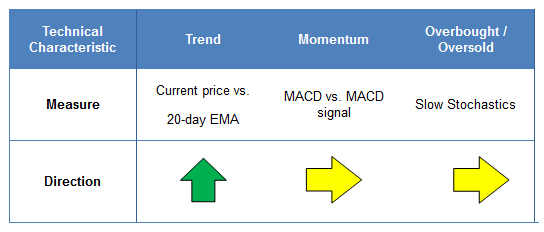
- GBPUSD still holding around the 1.5600 level
- MACD and Slow Stochastics show balanced, two-way tradeKey near-term resistance still looms at 1.5675
GBPUSD edged higher within its near-term range early last week, testing resistance at 1.5675 midweek before dropping back toward 1.5600 as of writing. With both the MACD and Slow Stochastics in neutral territory, traders may opt to adopt a neutral bias heading into the new trading week and react to the price action and news announcements, including Wednesday’s highlyanticipated FOMC minutes and July CPI data, as they come.
Source: FOREX.com
USD/JPY
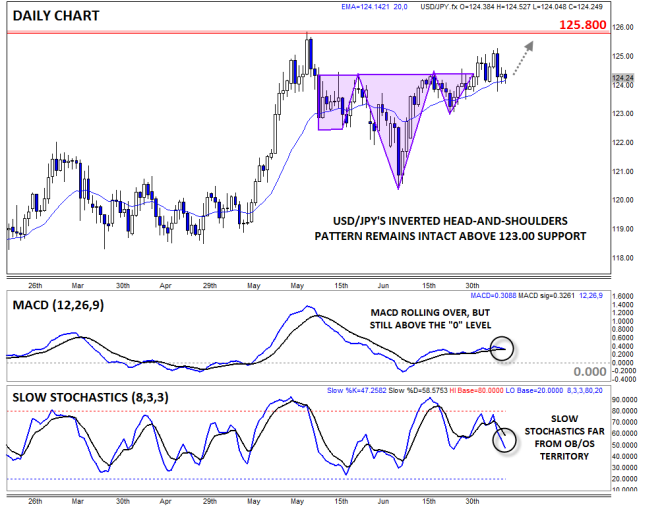
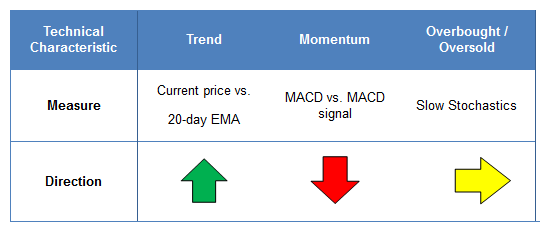
- USDJPY ended last week essentially unchanged after briefly spiking above 125.00
- MACD and Slow Stochastics show balanced, two-way tradeMedium-term bias still generally bullish above “right shoulder” low at 123.00
USDJPY rallied early last week before reversing back down to trade back in the lower 124.00s as of writing. After the relatively lackluster week, it’s not surprising to see both the MACD and Slow Stochastics signaling balanced two-way trade. However, the medium-term inverted head-and-shoulders pattern remains intact above the right shoulder lower at 123.00, so the medium-term bias remains generally bullish heading into this week.
Source: FOREX.com
USD/CAD
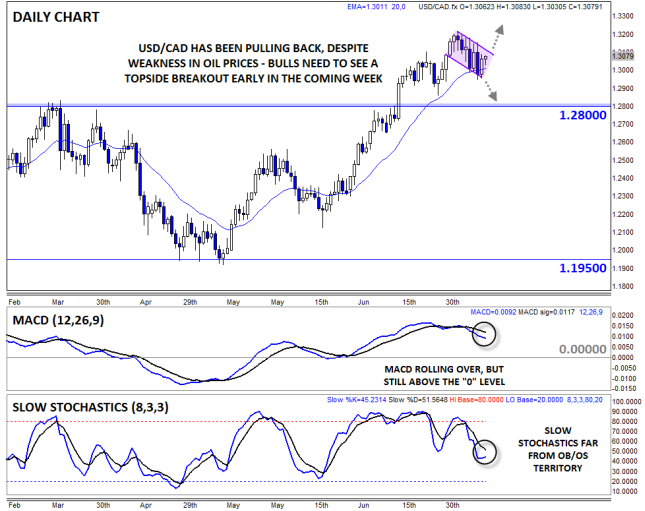
- USD/CAD pulled back last week, despite the big breakdown in oil prices
- MACD rolling over, showing fading bullish momentum
- A conclusive break from the near-term consolidation pattern should signal this week’s move
USD/CAD is our currency pair in play this week due to a number of high-impact economic reports out of the US and Canada in the coming week (see “Data Highlights” below for more). Disappointingly for the bulls, the pair pulled back last week, despite a big drop in oil prices. From a technical perspective, the pair is still showing a possible bullish flag pattern, but buyers need to the see it break higher early this week to confirm the pattern. For its part, the MACD indicator has rolled over, showing waning bullish momentum. A bullish breakout this week could target 1.3200 or 1.3300 in time, whereas a bearish breakdown could expose 1.2800 support next.
Source: FOREX.com
The Yuan’s Wild Ride towards SDR Status
Last week the People’s Bank of China (PBoC) shocked the market by lowering its reference rate for USD/CNY by 1.9% in one day, the largest move since the mid-1990s; then in the following days the bank lowered the rate twice more, but not by nearly as much. The surprise drop in the yuan ricocheted throughout the FX market instantly, as investors became nervous about the underlying reasons for the move and the effect it would have on global inflation and asset prices. Commodity currencies like the Australian and New Zealand dollar plummeted on the news, with AUDUSD even touching its lowest level since May 2005.The move by the PBoC was designed to ease some pressure on China’s export market and was in direct response to dismal economic data out of China. Exports fell 8.3% y/y, completely missing an expected 1.5% drop, and imports fell for the ninth month in a row in July (-8.1% y/y). Clearly the domestic economy is struggling from a lack of demand, both from within China and globally, and a relatively strong currency. The dramatic drop in the reference rate should make Chinese exports more competitive and, in turn, spur economic growth. It also has seemingly improved the yuan’s chances of being included in the IMF’s exclusive special drawings rights (SDR) basket.
The IMF responded to Beijing’s lower reference rate by stating that a more market-determined rate will facilitate SDR operations, implying that that they agree with the move and that China should aim for a floating exchange rate system in 2-3 years. There are clear benefits for China if the yuan is included in the SDR, which already includes the US dollar, yen, euro and British pound, as it would solidify the yuan as a globally traded currency. However, China’s extensive capital controls and some doubts about its commitment to reform, as evidenced by a mass rescue of its stock markets, are making the IMF nervous.
There are two main criteria to determine whether a currency can be included in the SDR. The currency must be freely tradable and the issuing nation must be a major player in the export market. There’s no doubt that China satisfies the latter – it stands behind Europe and the US but ahead of Japan and the UK in regards to contribution to global exports – but the yuan is not freely tradable by most definitions. As we’ve previously stated, the renminbi (RMB) is loosely pegged to the US dollar, there are restrictions on how much residents can take out of the country and it’s hard to get even the limited amount of money allowed into its capital markets. However, the RMB is widely used in international transactions and its usage is increasing year-by-year. It is being more widely used as a reserve currency as the government opens up its capital markets; it is now ranked around 7th among currencies in use by countries’ official reserve assets. Also, it’s accounting for more of the international debt market and for a significant amount of cross-broader payments, while similarly increasing its usage in the spot market. In fact, it’s hard to see the yuan not being included in the SDR at some point, especially if the PBoC continues to relinquish its grip on USD/CNY and Beijing continues to open up its capital markets.
USD/CNY
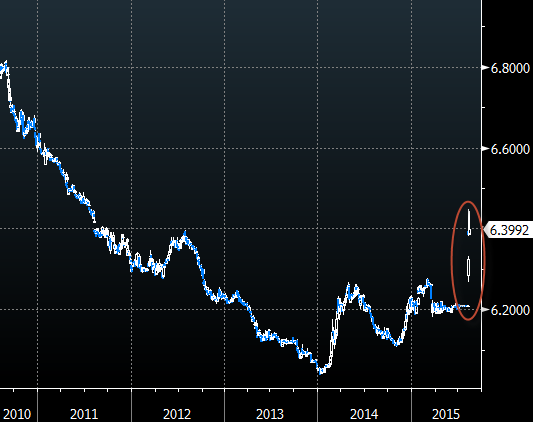
The chart below illustrates how dramatic the moves by the PBoC last week were. At its highest point last week, USD/CNY had moved to levels unseen since mid-2011 and the pair moved more in three days than it had in the preceding two years. However, the PBoC was quick to dispel rumors that this was the beginning of a prolonged period of engineered deflation in the yuan, which helped push USDCNY back through 6.4000. The bank cemented this by setting the reference rate higher the next day. This week, our attention is turning back to the US for a deluge of economic data and the release of the FOMC’s latest meeting minutes.
Source: FOREX.com
Look Ahead: Stocks
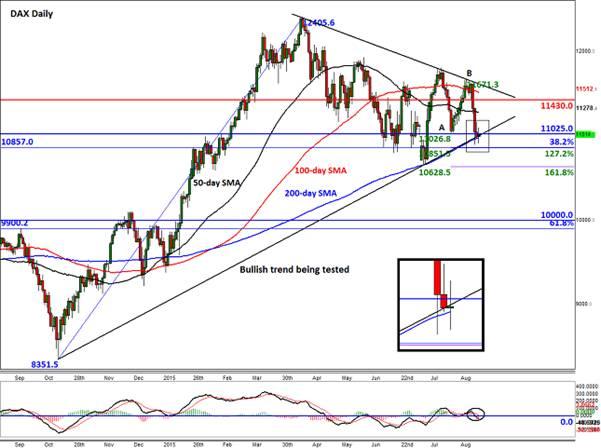
European stocks fell sharply earlier this week due in part to concerns over China. Sentiment was hurt after the People's Bank of China’s decision to sharply devalue its currency and as some of the latest macroeconomic pointers from the world’s second largest economy, most notably the latest industrial production, disappointed expectations. Investors are concerned that the weaker yuan combined with a slowdown in economic growth means Eurozone exports – in particular, German vehicles – to China could be hit hard. For this reason, the German DAX index has been one of the weakest performing global stock indices this week. Investors are also unnerved that the shock currency devaluation risks igniting the so-called currency wars, and are disappointed further that China did not opt instead for a sharp rate cut. But is the market overreacting to the news? Essentially, a weaker yuan should help to support Chinese exports and hopefully revive growth there. What’s more, the world’s other major central banks are still pretty much dovish, including the European Central Bank. As a result of the increased risk aversion, the yield on the two-year German bond has fallen to a fresh record low this week. This makes the European stock markets appear more appealing following their latest pullback. But so far, the stock market bulls have opted to stay on the sidelines and may remain there if the selling pressure doesn’t abate soon.At the time of this writing on Friday, the DAX was testing a major support area around 11,000. Here, the 200-day moving average (10975) converges with a medium-term bullish trend line. Though the index has tried to break this level several times already this week, we have yet to see a decisive finish below this level. In part, the hesitation here could have been due to the sellers taking profit. If indeed it is profit-taking that has been providing some limited support, then things could get ugly early next week. But given the technical importance of this area, the index could potentially stage a significant rally from here. Whichever direction the index goes from here, the resulting break could be significant. Thus, there could well be some favorable risk-to-reward trade opportunities coming up.
If the index holds firm here then it may rally back towards the 50-day moving average at 11275 initially ahead of 11430 next; the latter was previously support and so could turn into resistance upon retest. But for as long as the index remains beneath the short-term bearish trend line and the previous high at 11670, the bulls will have to be nimble. If and when the DAX creates a new “higher high,” a more profound rally could get underway. Meanwhile, if the DAX breaks below the 200-day moving average support on a closing basis then the Fibonacci extension levels of the most recent upswing (from point A to B) at 10850 (127.2%) and 10630 (161.8%) could be the next logical targets. Incidentally, the 10850 level also corresponds with the longer term 38.2% Fibonacci retracement of the upswing from the October low, while 10630 is only just slightly below the July low of 10650. Thus, we wouldn’t be surprised if the DAX were to find good support from these levels in the event of a break below the 200-day average. But worrying for the bulls, there are no further major supports below July’s low until some 500-600 points lower around 10,000/10100, or the long-term 61.8% Fibonacci level at 9900.
Source: FOREX.com
Look Ahead: Commodities
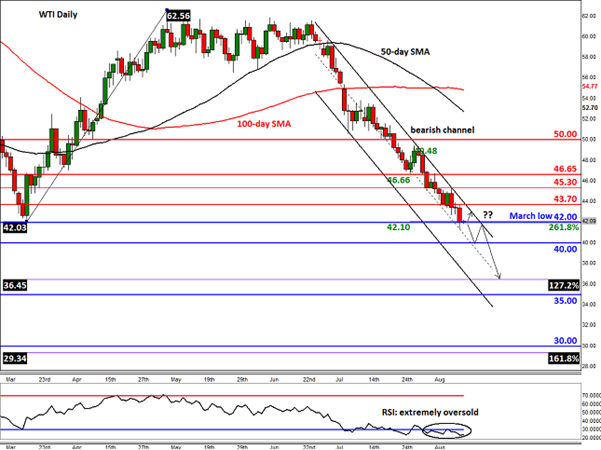
After falling for nine consecutive weeks, the price of WTI crude hit oil its lowest level since March 2009 on Thursday. Though US oil bounced off the low ($41.35) on Friday, it remains near this year’s earlier base of about $42 and thus on course to potentially fall to $40 a barrel next. That being said though, the correction potential is now high as “bargain hunters” try to buy “cheap” oil and the sellers take profit; if seen, this would probably only lead to a temporary bounce. After all, the end of the summer driving season is approaching and refineries will have to scale back their operation because of lower demand then and the usual maintenance work. Thus, the almost consistent, but moderate, seasonal destocking that has occurred since early May will likely come to an end soon. As a result, US oil inventories are likely to remain near – or surpass – their current record-high levels. As nothing is likely to be done about the supply glut this year and the expected growth in demand is set to remain weak, oil prices are therefore unlikely to stage a meaningful comeback this year. In fact, the global surplus is expected to increase further as a result of higher Iranian and OPEC output. The supply and demand forces therefore point to lower equilibrium prices. But the markets work based on expectations, so it could be that everything we have just noted is already priced in. There would probably need to be some sort of fresh stimulus to give the sellers confident to commit to their positions at these low levels. So, while still bearish on oil, we are wary of a potential bounce back in the short term from these levels because of the lack of any fresh stimulus and also technical reasons.WTI’s previous bounce in March from around the $42 area was significant in both nominal and percentage terms, as after all prices did rally from that base by about $20.50 or almost 49%. However, when compared to the sell-off that had occurred in the preceding months that bounce was not too significant after all. In fact, WTI did not even manage to test, let alone break, the shallow 38.2% Fibonacci retracement at $67.00. A shallow retracement (on a relative basis) is usually indicative of further strong continuation moves. As such, if WTI breaks decisively below $42 next week, we may see an eventual continuation to at least the 161.8% Fibonacci exhaustion point of the kick-back rally that had occurred in March, rather than just the 127.2% level. This points to a price level for WTI of just below $30 a barrel, namely $29.35. If we get there, the probability of price finding a significant bottom there would be very high, but that’s not to say that it won’t fall even further to say $25 or, who knows, even $20 per barrel.
But as noted, given the technical importance of the $42 handle plus the fact that the RSI is in extremely oversold levels, WTI may stage a short-term bounce towards the upper trend of its bearish channel around $43.70 before deciding on its next move. What’s more, the dollar rally has faded and this could offer an indirect boost for some buck-denominated commodities including crude oil. A more significant rally may occur if WTI manages to break out of its bearish channel.
Source: FOREX.com
Global Data Highlights
Sunday, August 162350GMT – Japan GDP (Q2)
A deluge of soft economic numbers for Q2 doesn’t bode well for growth figures for the quarter. Traded exposed sectors are suffering from soft global demand and a weak yen isn’t helping as much as previously thought. In the core of the economy, machinery orders figures released last week showed a massive 7.9% fall in capital spending during June. Overall, we’re expecting the economy to have shrunk a seasonally adjusted 0.5% in Q2 and the annualized pace of growth to plummet to -1.8% q/q.
Monday, August 17
No significant data releases.
Tuesday, August 18
0130GMT – RBA meeting minutes (August)
This was an almost game-changing meeting for the Australian dollar. At the meeting, the bank completely removed its dovish bias and a ceiling on AUD by withdrawing its verbal assault on the currency. The RBA was also more upbeat on the Australian economy, implicitly highlighting an uptick in business confidence. However, business confidence figures had taken a big hit since then and the Aussie has climbed.
0830GMT – UK CPI (July)
The already slim chance of the BoE hiking sooner than the Fed seems to be fading, largely because of a soft outlook for inflation. After emerging from a period of deflation at the beginning of the year, consumer prices have been broadly pushing higher month-by-month. This all changed in June when the pace of CPI growth slowed to 0%. In July, we’re expecting return to deflationary conditions marked by a 0.3% m/m drop in headline CPI; core-CPI is expected to remain at 0.8% y/y.
1230GMT – US building permits (July)
According to a survey by Bloomberg, US housing starts probably increased for the second month in a row during July. The market is being helped by steady jobs growth and low mortgage rates, which should lead to a 1,200k jump in July. This index can sometimes take a backseat to other headline figures, but it’s worth keeping an eye on how treasuries and the US dollar react.
Wednesday, August 19
1230GMT – US CPI
The question of when the Fed will begin hiking interest rates is one of, if not the biggest, event in the FX market this year. While the economy is heading in the right direction, driven by a very strong jobs market, consumer price growth remains depressed, which is keeping the Fed on the sidelines. In July, we’re expecting the pace of inflation to drop to 0.2% from 0.3% m/m, but year-on-year the pace of inflation may increase to 0.2% from 0.1%.
1800GMT – FOMC meeting minutes
The market is actively attempting to determine if the Fed will hike interest rates at its next policy meeting in September. These minutes may shed more light on the Fed’s decision making process. At the meeting in question, the Fed didn’t give much away, which was almost a signal to the market that it isn’t as close to raising interest rates as Fed hawks are hoping it is.
Thursday, August 20
0830GMT – UK retail sales (July)
Retail sales ex. auto fuel unexpectedly dipped in June by 0.2%, although the year-on-year growth rate still remained strong at 4.2%. This time we are expecting a slight drop in y/y growth to 4.1%, which is still strong, and month-on-month growth to increase 0.2%. This report should have a limited impact on the pound unless these estimates completely miss or beat expectations.
1230GMT – US unemployment claims (August 15)
This is likely to be a non-event for the US dollar unless the headline number misses expectations. US initial jobless claims have steadily been trending lower since the beginning of 2009 and are now hovering below pre-crisis levels. This time around we are expecting unemployment claims of 270K.
1400GMT – US Philly Fed Manufacturing Index (August)
The health of the US manufacturing sector is another important part of the Fed’s policy mix. This month we’re expecting a slight improvement to 7 from 5.7 in July, which may help to fuel Fed hawks as they push for a rate hike in September.
Friday, August 21
1230GMT – Canada CPI (July)
A stagnant economy that doesn’t appear to be responding to prior easing makes the possibility of further interest rate cuts or even a form of quantitative easing in Canada fairly likely. At the time of writing, it’s unclear what the market is expecting for inflation in July, although month-on-month inflation is very close to returning to deflationary territory. A softer-than-expected print could push the BOC into an even more dovish stance.
Recommended Content
Editors’ Picks
EUR/USD flirts with 1.0700 post-US PMIs

EUR/USD maintains its daily gains and climbs to fresh highs near the 1.0700 mark against the backdrop of the resumption of the selling pressure in the Greenback, in the wake of weaker-than-expected flash US PMIs for the month of April.
GBP/USD surpasses 1.2400 on further Dollar selling

Persistent bearish tone in the US Dollar lends support to the broad risk complex and bolsters the recovery in GBP/USD, which manages well to rise to fresh highs north of 1.2400 the figure post-US PMIs.
Gold trims losses on disappointing US PMIs

Gold (XAU/USD) reclaims part of the ground lost and pares initial losses on the back of further weakness in the Greenback following disheartening US PMIs prints.
Here’s why Ondo price hit new ATH amid bearish market outlook Premium

Ondo price shows no signs of slowing down after setting up an all-time high (ATH) at $1.05 on March 31. This development is likely to be followed by a correction and ATH but not necessarily in that order.
Germany’s economic come back

Germany is the sick man of Europe no more. Thanks to its service sector, it now appears that it will exit recession, and the economic future could be bright. The PMI data for April surprised on the upside for Germany, led by the service sector.