Highlights
- Market Movers: Weekly Technical Outlook
- Is Last Week's Volatility the Shape of Things to Come?
- Look Ahead: Stocks
- Look Ahead: Commodities
- Global Data Highlights
Market Movers: Weekly Technical Outlook
Technical Developments to Watch:
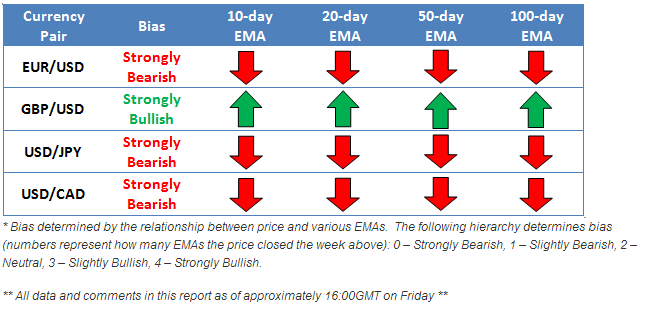
- EUR/USD marking time in the middle of its recent 1.35-1.37 range
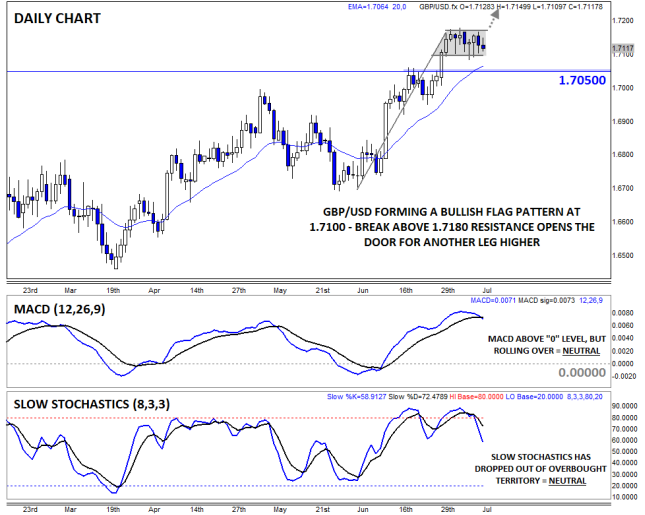
- GBP/USD forming a bullish flag above 1.7100 – potential breakout this week
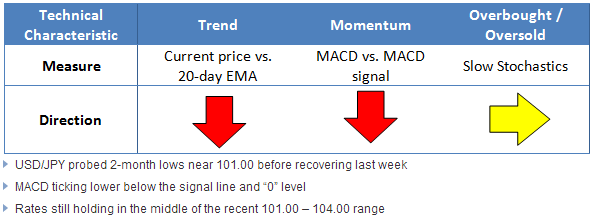
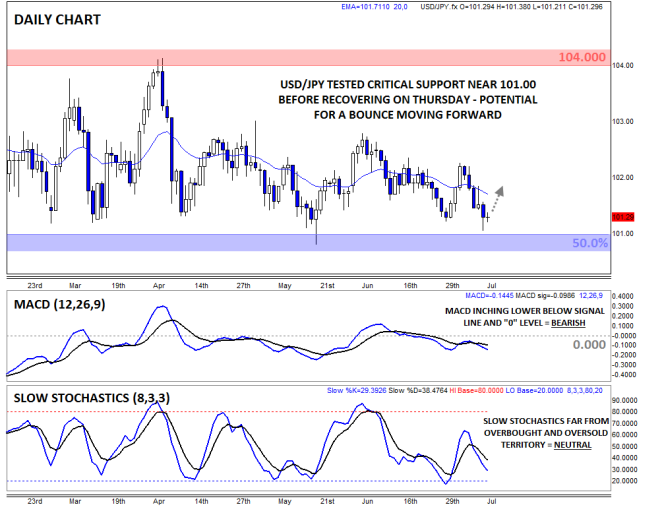
- USD/JPY holding above strong support in the 101.00 zone
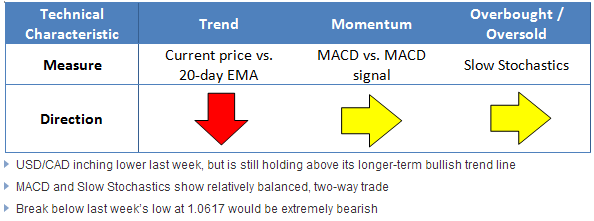
- USD/CAD bounce possible if 1.0700 resistance barrier is broken
EUR/USD
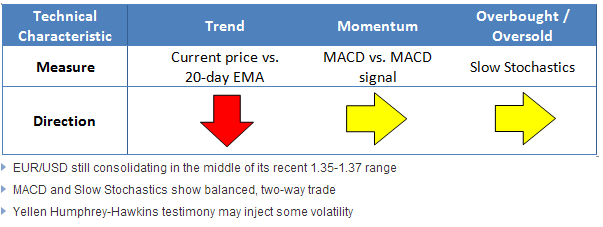
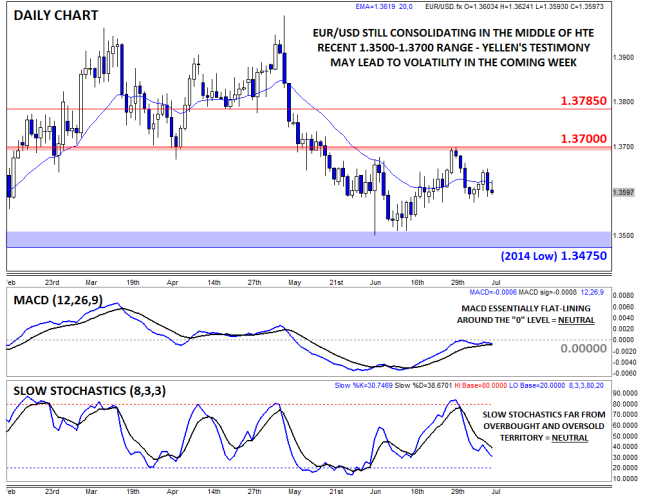
The EUR/USD essentially marked time in the middle of its recent 1.35-1.37 range last week, frustrating both bulls and bears alike. At this point, it feels as if nothing can wake the pair from its stupor, and the secondary indicators confirm this view. Both the MACD and Slow Stochastics are trading in neutral territory, showing balanced, two-way trade in the pair. For this week, EURUSD traders will be crossing their fingers that Fed Chair Janet Yellen’s Humphrey-Hawkins testimony can inject some volatility into the pair, but for now, our outlook is neutral.
GBP/USD
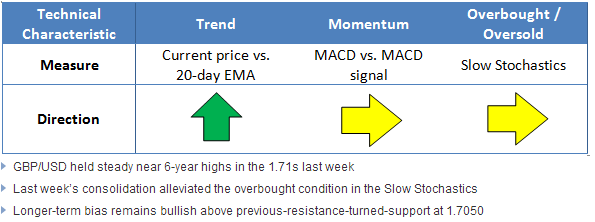
The GBP/USD had a quiet week, correcting the recent rally through time rather than a drop in price. Indeed, rates have carved out a potential bullish flag pattern, suggesting we could see another leg higher if the pair can clear its resistance level at 1.7180 this week. Meanwhile, the recent consolidation cleared the overbought condition in the Slow Stochastics, and the MACD is still well above its “0” level, suggesting the pair may be setting the stage for another rally. Our bias in the pair will remain to the topside as long as rates hold above previous-resistance-turned-support at 1.7050.
USD/JPY
The USD/JPY traded lower last week, but (and stop me if you’ve heard this one before) buyers stepped in to defend critical support at the 101.00 level. As of writing on Friday afternoon, rates have recovered back to the mid-101.00s and there is potential for a more substantial bounce heading into this week. Looking to the secondary indicators, the MACD is inching lower below its signal line, but is well within its recent range; the Slow Stochastics are in a similar situation. Heading into this week, a rally is favored, but if rates finally break below support in the 100.75-101.00 range, a move down toward 100.00 could be in the cards.
USD/CAD
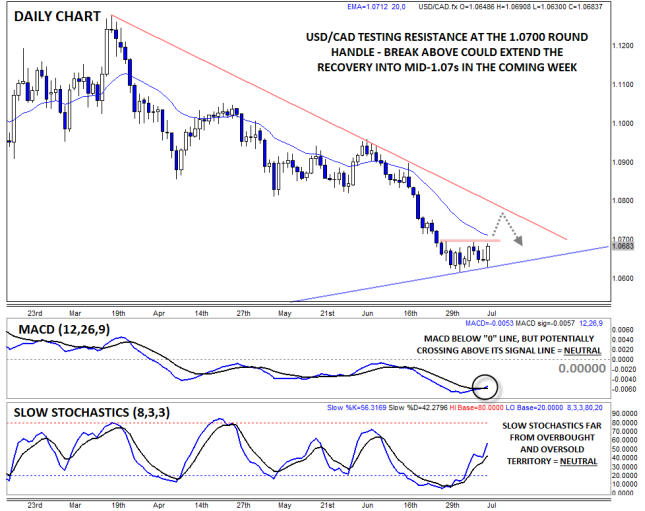
The USD/CAD is our currency pair in play due to a number of high-impact economic reports out of the US and Canada this week (see “Data Highlights” below for more). From a technical perspective, the pair inched lower last week to test its 18-month bullish trend line in the lower-1.06s early Friday before spiking back higher after a poor Canadian jobs report. The secondary indicators are not providing any additional insight, and as we go to press, the pair is pressing against resistance at the 1.0700 handle. If rates can clear this hurdle, a continuation up to the mid-1.0700s or even 1.0800 may be in the cards for this week.
Is Last Week’s Volatility the Shape of Things to Come?
The market has been remarkably sanguine about Europe’s peripheral economies in the last couple of years. Bond spreads between the most-troubled countries in the currency bloc and Germany had fallen (some to record low levels), bailed-out countries returned to the bond market and the sovereign debt crisis seemed like a distant memory. However, last week the ghost of the crisis made a timely reminder that it is still lingering around.
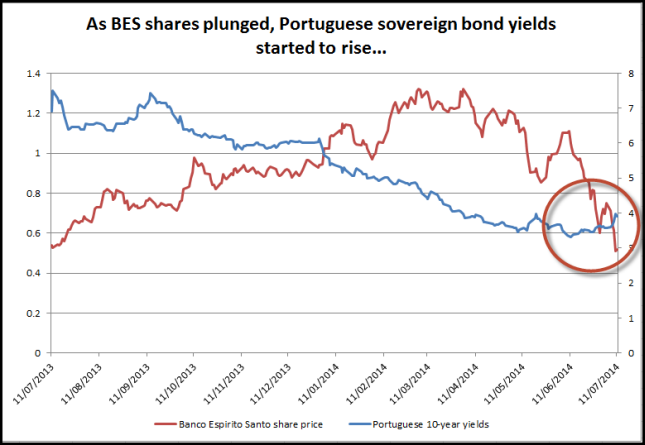
The epicentre was Portugal, where the bank holding company that owns Banco Espirito Santo (BES) delayed coupon payments on some short-term debt. This spooked the markets as fears about BES’s solvency started to grow. Its stock was suspended from trading after a sharp decline on Thursday, European markets sold off and Portuguese government bond yields rose above 4%, a rise of 40 basis points since the start of the week.
There were two things that spooked the markets about what was going on in Portugal:
1. Contagion - the fact that other banks in the region saw their share prices sell off, and
2. Sovereign bond yields rose, suggesting that the negative feedback loop between banks and sovereigns may still exist.
These two issues were considered “solved” when Draghi said two years ago that he would do “whatever it takes [to save the EUR].” Thursday’s price action suggests that the head of the ECB may need to remind markets of his pledge.
But should we be worried? In fairness, the BES situation does seem to be manageable. If the Portuguese government did have to recapitalise Portugal’s largest lender it would be the equivalent of approximately EUR 920M, about 0.6% of GDP. There is also the ESM bailout fund, specifically for banks, and the ECB’s new targeted long-term refinancing operations (TLTRO), which are designed to help banks in times of financial distress.
Things could become tricky if BES sees a further hit to its share price or a spike in deposit withdrawals; likewise, panic could rise if other Portuguese banks see deposits start to fall, suggesting that confidence is starting to drain from the Iberian nation’s financial sector. Another risk in the short to medium term would be if the ESM, which has yet to be passed by all national governments, is not allowed to be used to help a Portuguese bank in crisis to recapitalise.
At the end of last week, things had calmed down. Portuguese shares were rising, although the Lisbon index remains in a bear trend after falling more than 20% since March, and government bond yields had moderated. However, it is still a fluid situation, and any of the scenarios mentioned above could exacerbate the crisis.
In the short term, last week’s burst in volatility may pass, but while it may be premature to speculate that the Eurozone is about to re-enter a systemic crisis, we still think that fears and nervousness about Europe’s periphery could linger for the rest of the summer. Interestingly, EURUSD was remarkably resilient on Thursday, with the bulk of EUR selling against the JPY and GBP. However, if we see another escalation of peripheral fears, then the rush of speculative and real money flows from Portuguese debt and equity markets could be the canary in the coal mine for EURUSD.
A combination of renewed peripheral fears, weakening Eurozone economic data, and an ECB in easing mode could finally weigh on the EUR. Part of the EUR’s strength this year is down to the market’s fixation on when the Fed will loosen monetary policy. Although the Fed had extensive discussions about an exit strategy at its last meeting, the market does not expect the Fed to raise rates until mid-2015, which has kept a firm lid on the USD in recent months. Even if the Fed distances itself from a rate hike we still think that the EUR is vulnerable, and any move back to 1.3700 could be met by some heavy selling pressure. For now, EURUSD remains range bound, with a medium-term bias to the downside. Support lies at 1.3576, the July 7th low, then 1.3477 – the February 3rd low.
Look Ahead: Stocks
At first blush, this week’s drop in global stock indices looks like just another pullback within the long-term uptrend. And in all likelihood it is. But the recent dip gives us the opportunity to delve into a potentially bearish development simmering beneath the surface of the stock market’s rally as we head into the meat of the Q2 earnings season.
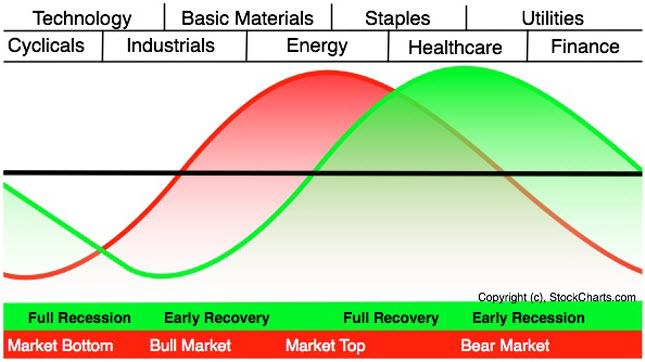
Sector rotation is a method of examining stock markets that goes beyond traditional technical analysis. In essence, it involves looking at what types of stocks are performing well to help predict how the stock market as a whole will perform moving forward. Historically, economically sensitive sectors like consumer cyclicals and industrial stocks tend to outperform the stock market in a healthy uptrend, while economically insensitive sectors like utilities and health care stocks typically outperform when the market is at risk of a pullback. Sector rotation “works” because most money managers must maintain a full allocation to stocks, regardless of their outlook for future performance. Therefore, the best way for them to mitigate losses in a bear market is to move funds out of high-flying speculative equities and into more conservative, stodgy stocks.
John Murphy, the godfather of intermarket analysis, developed the idealized sector rotation model shown below:
Source: Stockcharts.com
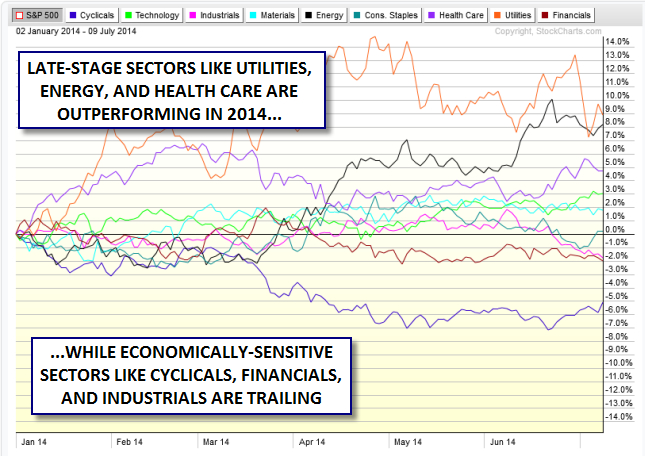
Looking to today’s market, the sector performance in the S&P500 suggests that we may be entering the twilight of the stock market’s rally. The three strongest performing sectors this year have been Utilities, Energy, and Health Care, corresponding with the “Market Top” stage in the image above. Meanwhile, economically-sensitive sectors like Consumer Cyclicals, Financials, and Industrials have trailed the S&P500 thus far this year, suggesting concern with the sustainability of this year’s rally:
Source: Stockcharts.com
Of course, sector rotation is just one way of looking at the market, and most other forms of analysis including breadth, momentum, and even basic price analysis are still waving the “all clear” flag for bulls (though bullish sentiment is also reaching concerning levels). For now, a strategy of “skeptical participation” in the equity rally is still favored, but continued bearish sector rotation may prove to be a harbinger of the long-awaited correction in the S&P 500.
Look Ahead: Commodities
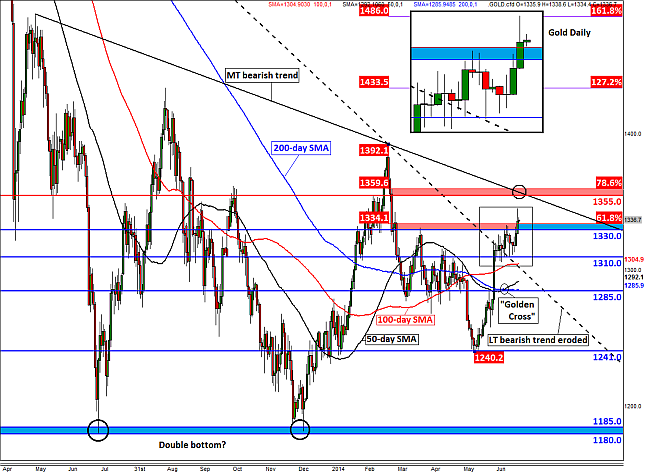
Gold is up for a sixth straight week, finding support from both fundamental and technical factors. Although the Indian government may have disappointed a few by refusing to reduce the 10% import duty on gold as it unveiled its 2014/5 budget on Thursday, the metal has nonetheless rallied. Prices have been driven higher, above all, by safe-haven buying as some riskier assets such as stocks dropped sharply to extend their recent weakness. Equities sold off mainly on fears about the health of Portuguese lender Banco Espirito Santo and caution ahead of the second-quarter US earnings season. Although concerns about the rebels’ advance in Iraq eased, the conflicts between Israel and Palestine escalated and this further boosted the appetite for the safe-haven asset. Also providing an indirect boost has been the slightly weaker dollar: the greenback has weakened about 1.8% against a basket of foreign currencies from its high in June following the release of mixed-bag US economic data and a less-hawkish-than-expected tone in the FOMC meeting minutes.
The increased appetite for gold has been evidenced in the ETF markets too. Total holdings at the world’s largest gold-backed ETF, the SPDR Gold Trust, has climbed to just over 800 tons – the highest amount since the middle of April. Although the increase is a healthy sign, holdings are still well below the levels witnessed in the preceding few years. These holdings would need to increase dramatically for gold prices to respond in a similar fashion. But it is a bit of a ‘chicken and egg’ story: do ETF holdings rise as result of firmer underlying asset prices – gold, in this case – or do the asset’s price rises as a result of increased ETF inflows? Either way, the fact of the matter is that they are rising and outflows have virtually stopped. This can only be a good sign from a bullish point of view, one would imagine.
Next week will see the release of some key economic data, some of which may well have an impact on gold prices. Among the highlights will by the US retail sales on Tuesday and Wednesday’s release of Chinese GDP and industrial production numbers. It is also worth paying close attention to comments from Fed Chair Janet Yellen who is due to testify on the Semi-Annual Monetary Policy Report before the House Financial Services Committee in Washington on Tuesday and Wednesday. For details, please refer to the Global Data Highlights section of the report below. The possibility of some dovish comments and/or disappointing US data should in theory support gold prices vis-à-vis the dollar. But gold’s reaction to Chinese data will probably be positively correlated as signs of improvement (weakness) there would point to higher (lower) industrial and jewellery demand for the metal.
From a technical point of view, the spike in the price of gold has probably been fuelled by the fact that a large number of stop-loss orders, sitting above the recent two-week consolidative range, were tripped which forced many bearish speculators to abandon their positions. As can be seen on the chart, the yellow precious metal had struggled to break through the $1325/30 area for a number of days. But the pullbacks from there were only 10-15 bucks each time, suggesting that the control was with the bulls. Now that another major hurdle has been broken, the bears’ control has correspondingly diminished. As more and more resistance levels fall, we will likely see further position squaring by the existing sellers. Meanwhile, some of the bullish speculators who have been on the side lines are likely to come back into play as the metal climbs higher, but with one resistance area cleared another is fast approaching around $1355/60. This is where a medium-term bearish trend line meets the 78.6% Fibonacci retracement level of the down move from the March high of $1392. If and when this area is taken out then we would not only expect gold prices to reach the March peak, but break above it too and head higher. Meanwhile support is likely to be provided by levels that were formerly resistance, such as $1330. We maintain our short-term bullish view on gold until and unless it breaks back below $1310 on a daily closing basis.
Global Data Highlights
Monday, July 14, 2014
- 9:00 GMT Eurozone Industrial Production
The market expects production to have fallen 1.2%, pushing the annual rate down to 0.5%. The risks are to the downside after German industrial production for May fell 1.8%, the largest monthly fall since April 2012. This is a volatile index, but it looks like European production took a nap at the start of the summer. If we continue to see peripheral bond yields rise this week, then weakness in European economic data may start to weigh on the single currency.
Tuesday, July 15, 2014
- 1:30 GMT Reserve Bank of Australia’s Meeting Minutes
The RBA has been calm and serene on the monetary policy front for a few months now as they continue to maintain a neutral policy stance. There is a chance that concerns over an overvalued currency could be evident in the bank’s meeting minutes, but that was already verbalized by RBA head Glenn Stevens in a recent speech, so that is old news. Therefore, unless the overvaluation concern borders on discussion of an interest rate cut, the AUD could emerge from this release stronger.
- 4:00 GMT Bank of Japan Interest Rate Decision
All Industries Activity, -4.3%; Household Spending, -8.0%; Retail Sales, -0.4%; Industrial Production, 0.5%; Housing Starts, -15.0%; Core Machinery Orders, -19.5%! Just in case you’re not picking up what I’m putting down, the data hasn’t been pretty. It doesn’t appear the Japanese consumer has held up too strongly after the 3% sales tax increase that went in to effect in April, and now the BoJ has a decision to make. Will they act quickly to supplement the failing economy by increasing Quantitative and Qualitative Easing with swiftness, or do they continue to sit on their hands and claim that they don’t have enough data yet? Considering the typical glacial pace central banks move, the market may be expecting the latter and in the process, the pain trade may come in to play as the USD/JPY continues to move sideways or challenges the psychological 100 barrier.
- 8:30 GMT UK ONS House Price Data
The official house price index will be closely watched now that the Bank of England is focusing on the housing market and considering a broad measure of macro-prudential tools to try and avert a housing bubble. In April this index reported that house prices rose by 9.9% YoY, the fastest pace of growth since 2010. Another lurch higher in prices could limit any losses in the pound from weak CPI data, and focus minds on a BOE rate hike as early as the end of this year.
- 8:30 GMT UK Inflation Data
This morning sees a dump of UK inflation data including CPI, RPI (retail price index) and producer prices for last month. The most important data point to watch is the annual headline CPI. This has been trending lower in recent months and in May it fell to its lowest level since 2009 at 1.5%. The market is expecting a slight uptick in the annual rate to 1.6%; however the monthly rate is expected to fall -0.1%. The risk is to the downside after the British Retail Consortium said that shop prices in June fell at their fastest level since 2007, dropping 1.8% YoY. The BRC data showed that the decline was largest in the non-food sector, where prices fell 3.4%, while even food prices rose at their slowest pace since the series began. A weaker than expected reading for inflation could send the pound flying south, after it managed to weather last week’s volatility storm.
- 9:00 GMT Bank of England Governor Mark Carney Testimony to Politicians
This testimony will focus on the BOE’s June Financial Stability Report when the Bank introduced some measures to limit risky mortgage lending in the housing market. We don’t think that Carney will stray too far off script, so this testimony is unlikely to be market moving. However, at the time of the report, the measures were considered fairly toothless, so if Carney and co. suggest that more macro measures could be on the way, then this may weigh on GBP as it could reduce the need to hike rates sooner rather than later.
- 9:00 GMT German ZEW Survey
This is one of the first surveys of the month, and the market expects a slowdown in both the current situation index (to 67.5 from 67.7) and the expectations index, (to 28.5 from 29.8). The risk is to the downside after last week’s sharp sell-off and the recent rise in peripheral bond spreads, which may have spooked business and investor confidence. However, if Germany wins the World Cup final on Sunday then we could see confidence pick up next month.
- 12:30 GMT US Retail Sales
The monumentally bad Q1 reading of GDP for the US gave many investors pause about the potential for future US growth, but subsequent releases of more current data like Non-Farm Payrolls has caused that skepticism to be short lived. It could return with a vengeance though if US data doesn’t deliver the goods, and Retail Sales is one that will be closely watched. The last two releases of Retail Sales failed to live up to the hype, and consensus is calling for a strong 0.6% rise this time around.
- 22:45 GMT New Zealand Consumer Price Index
It’s a slow news week for New Zealand, so a lot of attention may be paid to this quarterly inflationary measure. Most developed economies prefer their inflation to be somewhere in the vicinity of 2% year over year, and New Zealand is trending toward that mark; it has risen each of the last two quarters up to the current 1.6%. If the trend can continue, less concern over the high value of the NZD could be the ultimate outcome as inflation might continue to rise despite the popularity of its currency.
Wednesday, July 16, 2014
- 3:00 GMT Chinese Gross Domestic Product, Industrial Production, and Retail Sales
The industry talking heads like to call this a Chinese “data dump” due to the fact that they release a plethora of important measures simultaneously. The GDP reading may be the most important of the figures and is anticipated to continue its incredible growth by printing at 7.4%, right in line with the previous quarter. While this read has gradually been drifting lower, developed nations are envious of China’s continued strong growth. Concern over a Chinese slowdown has been waning, so any figure that fails to live up to the expectation might bring back another wave of fear and a risk-off move in the AUD and NZD.
- 8:30 GMT UK Labor Market Data
The market expects another solid labour market report from the UK, with the unemployment rate expected to moderate to 6.5% in May from 6.6% in April, the lowest level since January 2009. The market expects 205k new jobs to have been created in the three months to May and for the claimant count rate to fall to 3.1% in June, from 3.2% in May. The key part of this data release is wage data. The Bank of England has been looking closely at wage data in recent months, and it could be a key contributor to when the Bank starts raising rates. The market expects another dismal reading, with average weekly earnings dropping to 0.5% from 0.7%, the lowest level since late 2009. A further decline in wage growth could hurt sterling as the market digests what this means for the BOE.
- 9:00 GMT Eurozone Trade Balance
In April the trade balance continued its upward march. Europe’s trade balance has been in continuous surplus since Oct 2011, and is close to its highest ever level reached in March, when the seasonally adjusted surplus rose to EUR 17.8bn. We expect the trend of strong surplus’s to continue, which has been one of the long-term pillars underpinning the EUR.
- 13:00 GMT Bank of Canada Interest Rate Statement, Decision, and Policy Report
Canadian data releases have taken a turn for the worse recently with Ivey PMI remaining below the 50 level for a second month in a row and Canadian Unemployment ticking up to 7.1% from 7.0%. These are the types of figures that could make the BoC and Governor Steven Poloz take notice and may even prompt him to lean a little toward a dovish stance instead of the neutral one he has posed over the last few months. If that scenario comes into play, it could boost the USD/CAD and help retrace some of the losses it took in the month of June.
Thursday, July 17, 2014
- 9:00 GMT Eurozone Consumer Price Index
This is expected to confirm that prices remained at 0.5% on an annual basis; however, the monthly figure is expected to be revised up to 0.1% from -0.1%. Prices are likely to remain depressed in the currency bloc for some time; any downward revision to the June figure could spark a sell-off in EUR.
- 12:30 GMT US Housing Starts and Building Permits
While both of these figures missed their consensus last month in addition to declining from the previous month, they both posted respectable results either at or near the 1M psychological level. Expectations are for both of them to rise above that level this time around and could cement the thought that the US housing market is back on the right track.
Friday, July 18, 2014
- 8:00 GMT Eurozone Current Account
The current account in the currency bloc has been in surplus since 2011, and is close to its highest level ever as the trade surplus continues to expand. While this is good news for the currency and one factor that has been underpinning EUR strength in recent months, it does suggest that the economic rebalancing that is needed to boost the economy is not happening. A high current account surplus could also be weighing on inflation in the region.
- 13:55 GMT UM/Reuters US Consumer Sentiment Index
Considering the recent uptick in employment and the Federal Reserve’s indication that they are going to taper the final $15B of Quantitative Easing in one final shot, the US consumer should feel pretty good about himself. However, positive employment reports and the continued taper hasn’t emboldened consumers to feel particularly happy recently as the UM Consumer Sentiment Index has actually declined in the past couple months. Perhaps this is the month that people start to believe the positive press and their attitudes change because of it.
General Risk Warning for stocks, cryptocurrencies, ETP, FX & CFD Trading. Investment assets are leveraged products. Trading related to foreign exchange, commodities, financial indices, stocks, ETP, cryptocurrencies, and other underlying variables carry a high level of risk and can result in the loss of all of your investment. As such, variable investments may not be appropriate for all investors. You should not invest money that you cannot afford to lose. Before deciding to trade, you should become aware of all the risks associated with trading, and seek advice from an independent and suitably licensed financial advisor. Under no circumstances shall Witbrew LLC and associates have any liability to any person or entity for (a) any loss or damage in whole or part caused by, resulting from, or relating to any transactions related to investment trading or (b) any direct, indirect, special, consequential or incidental damages whatsoever.
Recommended Content
Editors’ Picks
EUR/USD clings to daily gains above 1.0650

EUR/USD gained traction and turned positive on the day above 1.0650. The improvement seen in risk mood following the earlier flight to safety weighs on the US Dollar ahead of the weekend and helps the pair push higher.
GBP/USD recovers toward 1.2450 after UK Retail Sales data

GBP/USD reversed its direction and advanced to the 1.2450 area after touching a fresh multi-month low below 1.2400 in the Asian session. The positive shift seen in risk mood on easing fears over a deepening Iran-Israel conflict supports the pair.
Gold holds steady at around $2,380 following earlier spike

Gold stabilized near $2,380 after spiking above $2,400 with the immediate reaction to reports of Israel striking Iran. Meanwhile, the pullback seen in the US Treasury bond yields helps XAU/USD hold its ground.
Bitcoin Weekly Forecast: BTC post-halving rally could be partially priced in Premium

Bitcoin price shows no signs of directional bias while it holds above $60,000. The fourth BTC halving is partially priced in, according to Deutsche Bank’s research.
Week ahead – US GDP and BoJ decision on top of next week’s agenda

US GDP, core PCE and PMIs the next tests for the Dollar. Investors await BoJ for guidance about next rate hike. EU and UK PMIs, as well as Australian CPIs also on tap.
