How low can oil go? That’s a question I think about every time I fill up at the gas-station nowadays. The trader in me kicks in almost immediately after to ask the more pertinent question: How can I make money out of this downtrend in Oil? As simple as it is going to sound the answer is to trade the trend and not try to pick bottoms.
In Blackwell’s latest quarterly report available on our website we talked about how there is a clear bearish dominance across all timeframes.
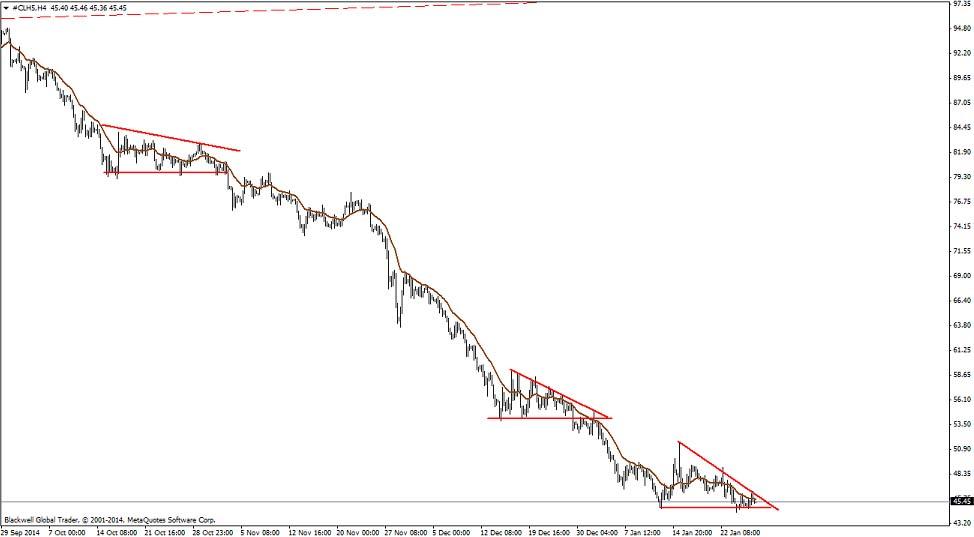
We suggested good opportunities can arise on bearish continuation patterns. One such pattern is emerging yet again, the bearish flag/descending triangle (however you like to call it). Basically it is a series lower highs heading into a level of support indicating weakening of bullish pressure from an order flow perspective - note the 3 cases in point in the chart below.
The current pattern on the H4 Oil chart has the most volatile waves of the 3 with volatility squeezing to a point. Traders can look to trade a breakout pullback set up if there is an impulsive break out of the lows at around 44.34.
Fundamentally, the global crude oil market still remains oversupplied with U.S. Crude stocks at its highest January level in more than 80 years. Recent retracements in Oil have just been off the back of a weaker dollar. The U.S. Energy Information Administration is scheduled to release its Weekly Petroleum Status Report at 1030hrs ET, 27/01/15. According to The Wall Street Journal, 11 analysts surveyed all predicted gains by an average of 4 million barrels. This data release could give the push required for a breakout so keep this event on your calendar.
Forex and CFDs are leveraged financial instruments. Trading on such leveraged products carries a high level of risk and may not be suitable for all investors. Please ensure that you read and fully understand the Risk Disclosure Policy before entering any transaction with Blackwell Global Investments Limited.
Recommended Content
Editors’ Picks
EUR/USD regains traction, recovers above 1.0700

EUR/USD regained its traction and turned positive on the day above 1.0700 in the American session. The US Dollar struggles to preserve its strength after the data from the US showed that the economy grew at a softer pace than expected in Q1.
GBP/USD returns to 1.2500 area in volatile session

GBP/USD reversed its direction and recovered to 1.2500 after falling to the 1.2450 area earlier in the day. Although markets remain risk-averse, the US Dollar struggles to find demand following the disappointing GDP data.
Gold holds around $2,330 after dismal US data

Gold fell below $2,320 in the early American session as US yields shot higher after the data showed a significant increase in the US GDP price deflator in Q1. With safe-haven flows dominating the markets, however, XAU/USD reversed its direction and rose above $2,340.
XRP extends its decline, crypto experts comment on Ripple stablecoin and benefits for XRP Ledger

Ripple extends decline to $0.52 on Thursday, wipes out weekly gains. Crypto expert asks Ripple CTO how the stablecoin will benefit the XRP Ledger and native token XRP.
After the US close, it’s the Tokyo CPI

After the US close, it’s the Tokyo CPI, a reliable indicator of the national number and then the BoJ policy announcement. Tokyo CPI ex food and energy in Japan was a rise to 2.90% in March from 2.50%.
