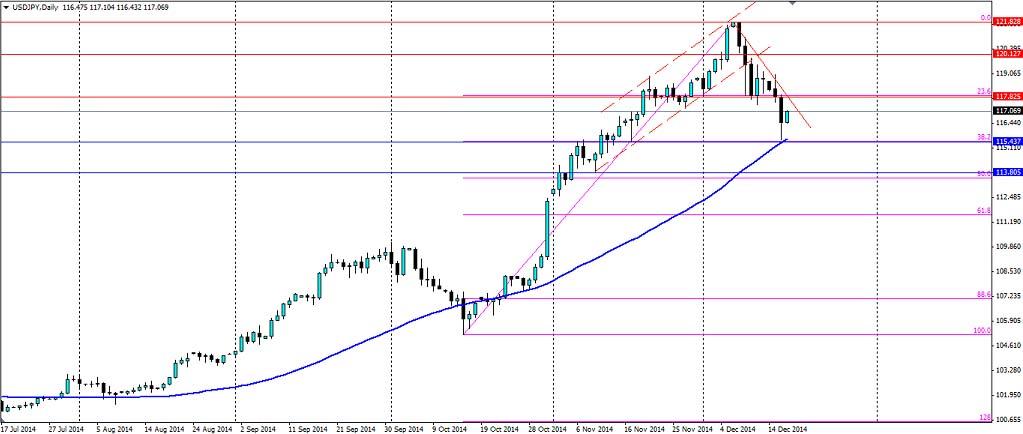
The Yen has not been shy of volatility or technical patterns. The technical patterns have defined the recent levels the Yen has played off and traders can take advantage of these as it continues.
The Yen has strengthened considerably from the high of 121.83 the USDJPY pair hit just 10 days ago. Since then it has retraced back down to 115.43 with a perfect touch on the 38.2% Fibonacci line. This touch also coincides with a touch of the 50 day simple moving average and the resistance turned support it found on the way up.
The weakening of the Yen was no surprise as the prospect of four more years of Abenomics will see the easing policies remain in Japan. What has been a surprise for the markets is the recent strength in the Yen. The market felt the Yen had depreciated too far, too fast, throw in falling oil prices, volatility in equities and a collapsing Russian economy and you have plenty of demand for the safe haven asset.
From here we could see the Yen push through the 38.2% fib line, in which case it will target the 50.0% line or the support slightly above it at 113.805. If that zone fails, the next target will be the 61.8% fib line.
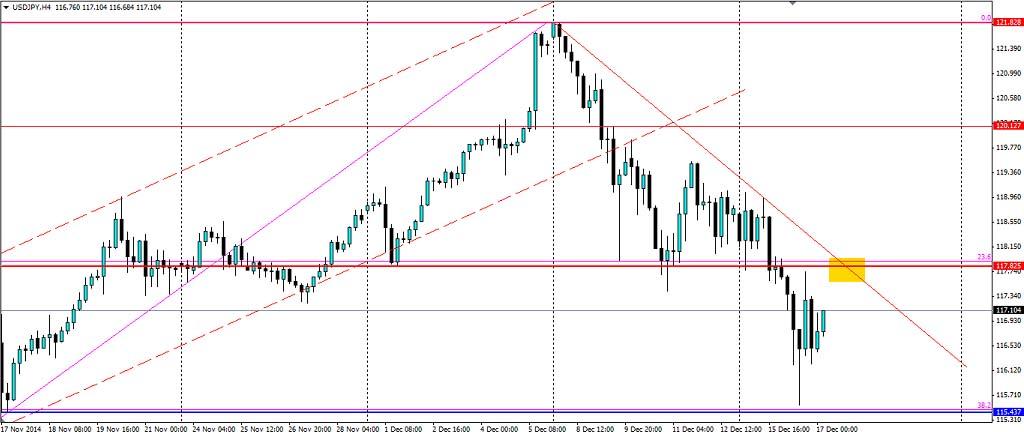
If the current pullback continues, the Yen will likely target the 23.6%, or the resistance at 117.825, which has already acted as a sticking point for the price. The current bearish trend on the H4 chart below is likely to come back into play. The zone in yellow may be an interesting target for the Yen and I wouldn’t be surprised to see a large number of short positions stacked there.
The Yen has looked for technical levels as it retraces from the highs found earlier this month. Regardless if it continues or looks to turn bullish, the technicals will provide traders with opportunities.
Forex and CFDs are leveraged financial instruments. Trading on such leveraged products carries a high level of risk and may not be suitable for all investors. Please ensure that you read and fully understand the Risk Disclosure Policy before entering any transaction with Blackwell Global Investments Limited.
Recommended Content
Editors’ Picks
AUD/USD remained bid above 0.6500

AUD/USD extended further its bullish performance, advancing for the fourth session in a row on Thursday, although a sustainable breakout of the key 200-day SMA at 0.6526 still remain elusive.
EUR/USD faces a minor resistance near at 1.0750

EUR/USD quickly left behind Wednesday’s small downtick and resumed its uptrend north of 1.0700 the figure, always on the back of the persistent sell-off in the US Dollar ahead of key PCE data on Friday.
Gold holds around $2,330 after dismal US data

Gold fell below $2,320 in the early American session as US yields shot higher after the data showed a significant increase in the US GDP price deflator in Q1. With safe-haven flows dominating the markets, however, XAU/USD reversed its direction and rose above $2,340.
Bitcoin price continues to get rejected from $65K resistance as SEC delays decision on spot BTC ETF options

Bitcoin (BTC) price has markets in disarray, provoking a broader market crash as it slumped to the $62,000 range on Thursday. Meanwhile, reverberations from spot BTC exchange-traded funds (ETFs) continue to influence the market.
US economy: slower growth with stronger inflation

The dollar strengthened, and stocks fell after statistical data from the US. The focus was on the preliminary estimate of GDP for the first quarter. Annualised quarterly growth came in at just 1.6%, down from the 2.5% and 3.4% previously forecast.

