USD/NOK
The dollar gained against almost all of its G10 counterparts and the EM currencies we track as rising geopolitical tensions created demand for the US currency.
The first Russian response to the sanctions from the West shocked the markets, increasing the worries that the crisis over Ukraine could deepen. If the nervousness in the markets remains and the geopolitical risks escalate we could see further depreciation of the Eastern European currencies like HUF, CZK and PLN.
The Norwegian krone had been falling vs USD during the European morning Thursday along with the rest of the market, but rallied to recover its opening levels after the country’s industrial production rose 5.7% mom in June, a rebound from -5.9% in May. The strong reading pushed USD/NOK down approximately 0.20%, leaving NOK as the only G10 currency that traded virtually unchanged against the greenback. Russia’s recent import restrictions apply to Norway as well, so this might affect negatively the currency somehow and push USD/NOK higher. However, I would remain neutral on USD/NOK at the moment, given that the technical picture shows signs of weakness and since there are no major indicators coming from Norway nor the US this week.
The focus is now on the press conference by ECB president Mario Draghi following the ECB Council meeting.
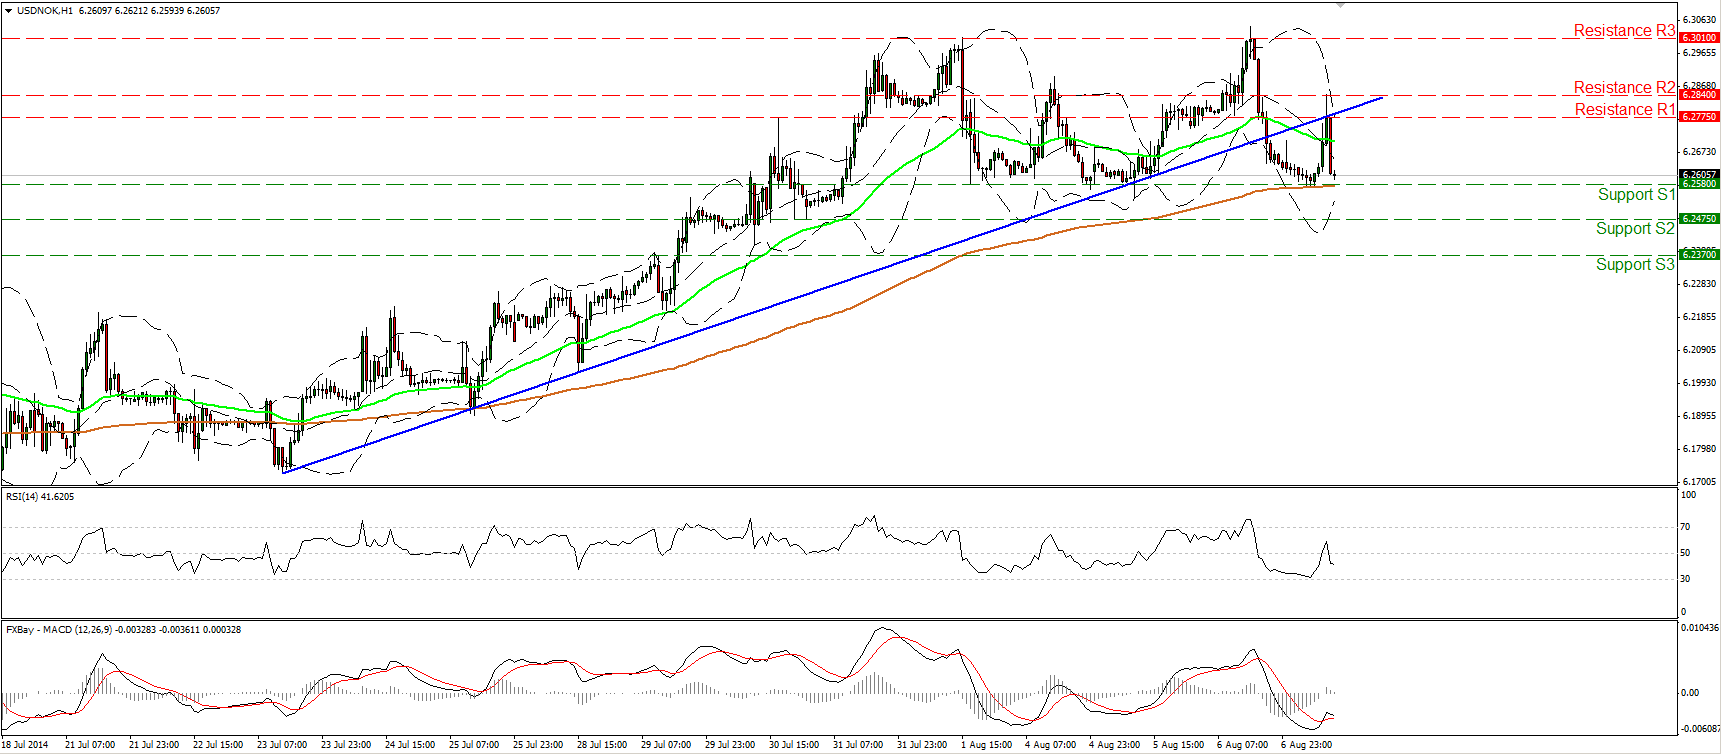
USD/NOK fell after finding resistance within the 6.2775/6.2840 area and also near the prior near-term uptrend line, drawn from back the lows of the 23rd of July. At the time of writing, the rate is trading marginally above the support barrier of 6.2580 (S1), which coincides with the 200-hour moving average. A clear move below that zone would confirm a forthcoming lower low and could signal the establishment of a newborn downtrend. The 14-hour RSI fell back below its 50 line, while the MACD, already negative seems ready to re-cross below its signal line, supporting the today’s negative momentum. On the daily chart, although the rate is trading above both the 50- and 200-day moving averages, I can see negative divergence between the price action and both our momentum studies, something that supports my negative view as far as the short-term outlook is concerned. It is worth noting that the last time, the rate managed to move above the 6.3010 (R3) zone, it was rejected and collapsed within the following month. The last time we had a daily close above 6.3010 (R3) was back in August 2010.
Support: 6.2580 (S1), 6.2475 (S2), 6.2370 (S3) .
Resistance: 6.2775 (R1), 6.2840 (R2), 6.3010 (R3).
Recommended Content
Editors’ Picks
EUR/USD regains traction, recovers above 1.0700

EUR/USD regained its traction and turned positive on the day above 1.0700 in the American session. The US Dollar struggles to preserve its strength after the data from the US showed that the economy grew at a softer pace than expected in Q1.
GBP/USD returns to 1.2500 area in volatile session

GBP/USD reversed its direction and recovered to 1.2500 after falling to the 1.2450 area earlier in the day. Although markets remain risk-averse, the US Dollar struggles to find demand following the disappointing GDP data.
Gold climbs above $2,340 following earlier drop

Gold fell below $2,320 in the early American session as US yields shot higher after the data showed a significant increase in the US GDP price deflator in Q1. With safe-haven flows dominating the markets, however, XAU/USD reversed its direction and rose above $2,340.
XRP extends its decline, crypto experts comment on Ripple stablecoin and benefits for XRP Ledger

Ripple extends decline to $0.52 on Thursday, wipes out weekly gains. Crypto expert asks Ripple CTO how the stablecoin will benefit the XRP Ledger and native token XRP.
After the US close, it’s the Tokyo CPI

After the US close, it’s the Tokyo CPI, a reliable indicator of the national number and then the BoJ policy announcement. Tokyo CPI ex food and energy in Japan was a rise to 2.90% in March from 2.50%.
