![]()
A surprise rate cut from the RBNZ a couple of weeks ago was enough to send the New Zealand dollar tumbling by a couple of hundred pips. However, there was no further follow-through in the selling pressure once the Kiwi reached the key 0.6600 support area. It has since bounced back sharply, helped in part by the rebounding commodity prices and a falling US dollar in response to mixed-bag data from the world’s largest economy and also dovish comments from top Federal Reserve officials, most recently from Chairwoman Janet Yellen on Tuesday.
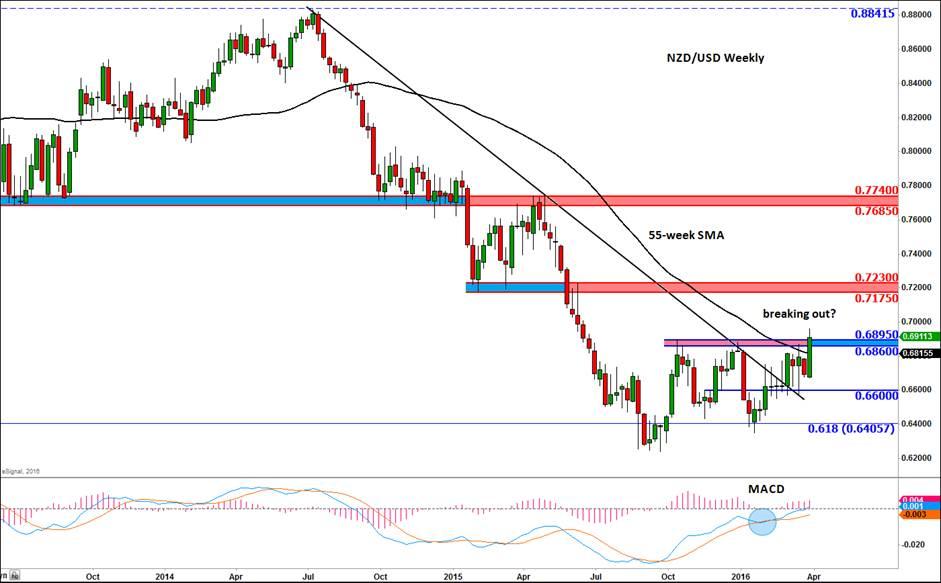
The resulting rally has helped to carve out a large bullish engulfing candle on the weekly chart of the NZD/USD, although this may change by the end of this week depending on the market’s reaction to the upcoming US data releases – the most important of which is likely to be Friday’s nonfarm payrolls data. Regardless of the shape of the weekly candle, the Kiwi has already broken though a major resistance zone in the 0.6860-0.6895 area. The bulls will need to hold their ground here by the close of play this week in order to confirm the breakout. While the NZD/USD holds above this area, the path of least resistance will be to the upside.
In addition to this week’s bullish engulfing candlestick formation, the NZD/USD has already created several other bullish-looking patterns on its charts, suggesting a significant bottom may have already been formed. On the weekly chart, it has created several doji candles around the bearish trend line that had been in place since July 2014. These indecisive-looking price patterns would have normally led to strong selling pressure if this was still a downward-trending market. But the lack of any significant follow-through in that direction strongly suggested that the trend was turning bullish and that a breakout was forthcoming. When the Kiwi finally took out the long-term bearish trend line, it formed a large bullish engulfing candle on the weekly time frame. Although there was no immediate follow-through ahead of that RBNZ policy decision, there has also been little selling interest with the buyers continually stepping in around the 0.66 handle.
Now that the buyers appear to have won this bull-bear battle, fresh momentum buying interest may see the Kiwi rise towards the next key reference points, as shown on the chart. The bulls may aim for the psychological handle of 0.7000 as their next immediate target. Above this level, the next potential resistance area is between 0.7175 and 0.7230 where the previous support meets the 38.2% Fibonacci retracement level (not drawn on the chart). The momentum indicator MACD, which had already formed a bullish crossover, is now trying to move above zero. This is further confirmation the bullish breakout.
At this stage, a break back below the previous resistance area of 0.6860-0.6895 would be deemed a bearish outcome in the short-term, while a move below the key support at 0.6600 would completely invalidate the breakout.
Trading leveraged products such as FX, CFDs and Spread Bets carry a high level of risk which means you could lose your capital and is therefore not suitable for all investors. All of this website’s contents and information provided by Fawad Razaqzada elsewhere, such as on telegram and other social channels, including news, opinions, market analyses, trade ideas, trade signals or other information are solely provided as general market commentary and do not constitute a recommendation or investment advice. Please ensure you fully understand the risks involved by reading our disclaimer, terms and policies.
Recommended Content
Editors’ Picks
EUR/USD clings to daily gains above 1.0650

EUR/USD gained traction and turned positive on the day above 1.0650. The improvement seen in risk mood following the earlier flight to safety weighs on the US Dollar ahead of the weekend and helps the pair push higher.
GBP/USD recovers toward 1.2450 after UK Retail Sales data

GBP/USD reversed its direction and advanced to the 1.2450 area after touching a fresh multi-month low below 1.2400 in the Asian session. The positive shift seen in risk mood on easing fears over a deepening Iran-Israel conflict supports the pair.
Gold holds steady at around $2,380 following earlier spike

Gold stabilized near $2,380 after spiking above $2,400 with the immediate reaction to reports of Israel striking Iran. Meanwhile, the pullback seen in the US Treasury bond yields helps XAU/USD hold its ground.
Bitcoin Weekly Forecast: BTC post-halving rally could be partially priced in Premium

Bitcoin price shows no signs of directional bias while it holds above $60,000. The fourth BTC halving is partially priced in, according to Deutsche Bank’s research.
Week ahead – US GDP and BoJ decision on top of next week’s agenda

US GDP, core PCE and PMIs the next tests for the Dollar. Investors await BoJ for guidance about next rate hike. EU and UK PMIs, as well as Australian CPIs also on tap.
