![]()
At the beginning of last week, we provided a “check-up” midway through the Q4 earnings season for the S&P 500, concluding that the four biggest themes were “falling earnings and sales, weak performance out of the energy sector, continued improvement in margins, and the dramatic impact of the US Dollar.” We’ll provide a full summary of the reports when earnings season is winding down, but once again, it looks like large US companies will see a decline in aggregate earnings and revenues.
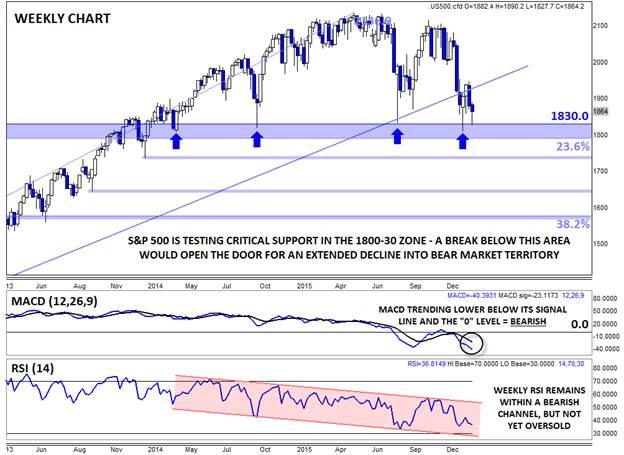
At the moment though, the more pressing issue is the technical picture. After the big drop to start the year, the S&P 500 has now broken below the nearly 7-year bullish trend line (arithmetic chart) off the 2009 lows and is testing a critical support area in the lower-1800s. This zone represents the previous lows from April 2014, October 2014, August 2015, and January of this year, as well as the 23.6% Fibonacci retracement of the whole 2009-2015 rally (1791). Bulls would argue that we’ve seen meaningful rallies the last four times we tested this support zone, though bears would be quick to note that the magnitude of those rallies has been declining (from a 300+ point move in 2014-2015 to a 280 point rally last year to just a 135 point rally over the last few weeks before we rolled over once again).
Not only are we seeing less and less conviction on each subsequent rally off the 1800 support zone, but the secondary indicators on the weekly chart are also more bearish than they’ve been in years. For one, the weekly MACD indicator is trending sharply lower below both its signal line and the “0” level, showing growing bearish momentum. Meanwhile, the weekly RSI remains within a 2-year bearish channel and is not even in oversold territory, suggesting that the index could fall further if 1800 support gives way.
Below 1800, there’s not much in the way of meaningful support until down around 1600; that said, we could see buyers step in around the minor lows at 1740 (Feb 2014) or 1640 (Aug-Oct 2013) along the way. Of course, betting against the long-term uptrend in stocks has been a fool’s errand over the last half-decade or so, so bears may opt to cut losses quickly, especially if the S&P 500 recovers back above last week’s high and the broken bullish trend line in the 1950 region.

This research is for informational purposes and should not be construed as personal advice. Trading any financial market involves risk. Trading on leverage involves risk of losses greater than deposits.
Recommended Content
Editors’ Picks
AUD/USD failed just ahead of the 200-day SMA

Finally, AUD/USD managed to break above the 0.6500 barrier on Wednesday, extending the weekly recovery, although its advance faltered just ahead of the 0.6530 region, where the key 200-day SMA sits.
EUR/USD met some decent resistance above 1.0700

EUR/USD remained unable to gather extra upside traction and surpass the 1.0700 hurdle in a convincing fashion on Wednesday, instead giving away part of the weekly gains against the backdrop of a decent bounce in the Dollar.
Gold keeps consolidating ahead of US first-tier figures

Gold finds it difficult to stage a rebound midweek following Monday's sharp decline but manages to hold above $2,300. The benchmark 10-year US Treasury bond yield stays in the green above 4.6% after US data, not allowing the pair to turn north.
Bitcoin price could be primed for correction as bearish activity grows near $66K area

Bitcoin (BTC) price managed to maintain a northbound trajectory after the April 20 halving, despite bold assertions by analysts that the event would be a “sell the news” situation. However, after four days of strength, the tables could be turning as a dark cloud now hovers above BTC price.
Bank of Japan's predicament: The BOJ is trapped

In this special edition of TradeGATEHub Live Trading, we're joined by guest speaker Tavi @TaviCosta, who shares his insights on the Bank of Japan's current predicament, stating, 'The BOJ is Trapped.'