![]()
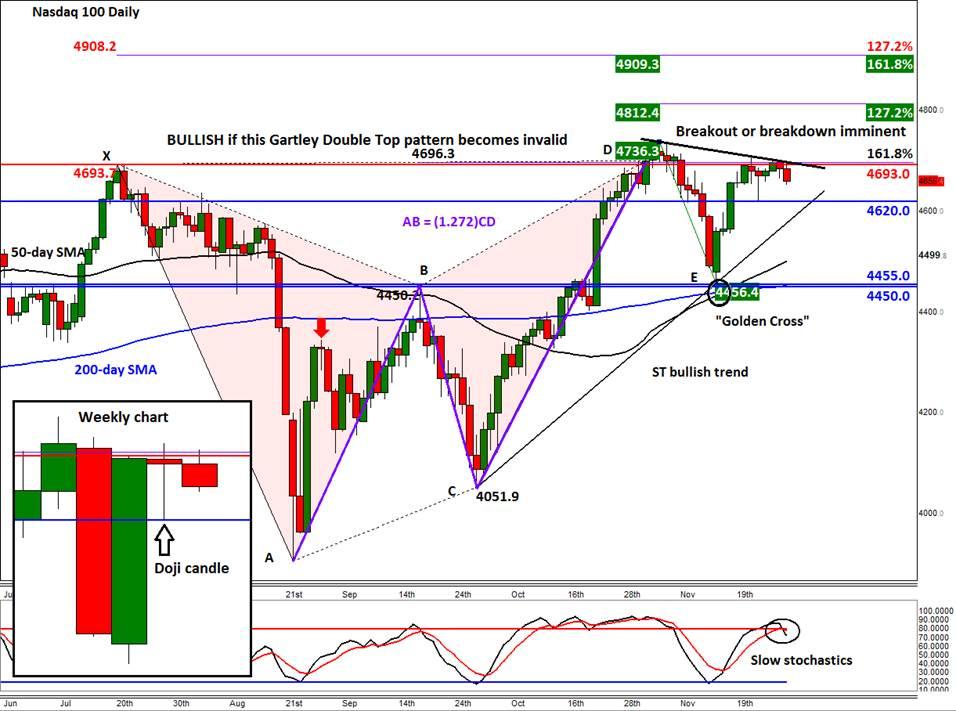
The Nasdaq 100 has been repeatedly hitting resistance around the July high of 4693, although it did manage to climb above here for a few days at the start of November. However, that breakout lacked conviction and the bulls were unable to hold their nerves for too long. As a result, it fell back all the way near resistance-turned-support around 4455 by mid-November. Here, the tech-heavy index found support, leading to another rally towards 4693 again. But as can be seen on the daily chart, a breakout is still elusive for the bulls.
In addition to the previous high, the abovementioned 4693 resistance also converges the extended point D of an ABCD formation and the 161.8% Fibonacci extension of the last notable drop from point B to C. In other words, 4693 marks the entry point of a Gartley Double Top pattern. So far this pattern hasn’t become invalidated and we have already seen a sizeable pullback at the start of the month. So it is still possible the index may find a more significant top here, especially since the bullish momentum is once again falling – as highlighted for example by the slow stochastics indicator.
That being said, no major support has broken down yet, with short-term support at 4620 and the bullish trend line slightly lower also holding. Should these levels break down then the selling pressure may increase and the downward move accelerate. Indeed, the doji candle on weekly chart (in the inset) also points to indecisiveness at these extremes. As such, one group of market participants – either the bulls or the bears – will soon be proven wrong, which could potentially lead to a sharp move in the direction of the break.
Still, for as long as the key support at 4450/55 area holds, the medium-term bullish trend would remain intact. Supporting the bullish case is the fact that the 50-day average has crossed above the 200 to create a “golden crossover.” What’s more, the rejections at 4693 have led to progressively smaller pullbacks, suggesting the Nasdaq 100 is gearing up for a potential breakout soon.
The bulls will now want to first and foremost see a closing break above 4693. Once achieved, they may then aim for the Fibonacci extension levels as their next targets, starting with the 127.2% extension of the DE move at 4812. The 161.8% extension of this price swing converges with the 127.2% of the XA swing at 4908/9, making it a more significant resistance area.
In short, either a break higher or lower looks imminent. Conservative traders may wish to wait for the index to make up its mind before jumping on the bandwagon.
Trading leveraged products such as FX, CFDs and Spread Bets carry a high level of risk which means you could lose your capital and is therefore not suitable for all investors. All of this website’s contents and information provided by Fawad Razaqzada elsewhere, such as on telegram and other social channels, including news, opinions, market analyses, trade ideas, trade signals or other information are solely provided as general market commentary and do not constitute a recommendation or investment advice. Please ensure you fully understand the risks involved by reading our disclaimer, terms and policies.
Recommended Content
Editors’ Picks
AUD/USD remained bid above 0.6500

AUD/USD extended further its bullish performance, advancing for the fourth session in a row on Thursday, although a sustainable breakout of the key 200-day SMA at 0.6526 still remain elusive.
EUR/USD faces a minor resistance near at 1.0750

EUR/USD quickly left behind Wednesday’s small downtick and resumed its uptrend north of 1.0700 the figure, always on the back of the persistent sell-off in the US Dollar ahead of key PCE data on Friday.
Gold holds around $2,330 after dismal US data

Gold fell below $2,320 in the early American session as US yields shot higher after the data showed a significant increase in the US GDP price deflator in Q1. With safe-haven flows dominating the markets, however, XAU/USD reversed its direction and rose above $2,340.
Bitcoin price continues to get rejected from $65K resistance as SEC delays decision on spot BTC ETF options

Bitcoin (BTC) price has markets in disarray, provoking a broader market crash as it slumped to the $62,000 range on Thursday. Meanwhile, reverberations from spot BTC exchange-traded funds (ETFs) continue to influence the market.
US economy: slower growth with stronger inflation

The dollar strengthened, and stocks fell after statistical data from the US. The focus was on the preliminary estimate of GDP for the first quarter. Annualised quarterly growth came in at just 1.6%, down from the 2.5% and 3.4% previously forecast.
