![]()
The global stock markets have rebounded strongly over the past few days following the recent turmoil. With China on holiday, concerns about the health of the world’s second largest economy have been put on the backburner for the time being, while the faltering recovery in the US and elsewhere have raised hopes the Federal Reserve will hold off raising interest rates from their record low levels for a few more months at the very least. As a result, the formula of bad data equals good news is back for the stock markets. Technically-minded market participants will also be happy to see a large number of global indices forming what look like technical reversal patterns on their charts following last week’s actions.
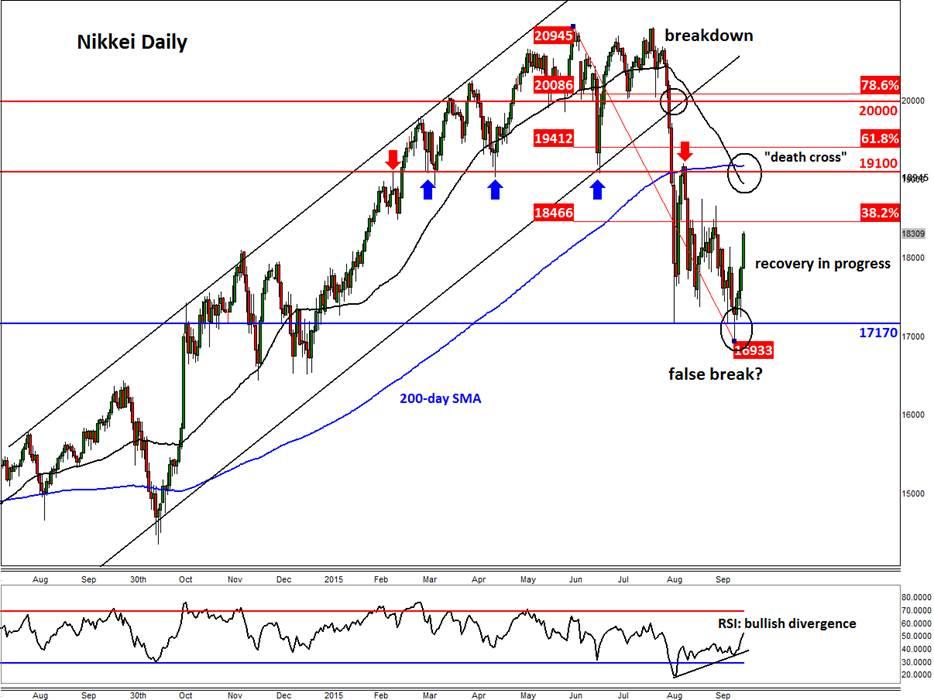
Today we are looking at Japan’s Nikkei index, which we find to be one of the most technically-friendly indices out there. The last time I looked at the Nikkei was at the end of August. Then, the stock market volatility was extremely high and we were doubtful that the Nikkei’s strong bounce off the 17170 support level would last long. We argued that it was not unusual to see wild swings like these when major trends change course. Growth concerns about China and the impact of a potential Federal Reserve rate increase in 2015 were among our main concerns then. In addition, we argued that there were plenty of buyers who still held large losing positions and that this group of market participants would have wanted to exit their positions when they had the opportunity to do so. We were extremely wary of another round of selling around the broken key support level of 19100.
As it turned out, the Nikkei did precisely what we had anticipated as did in fact turn lower from around 19100 before eventually revisiting the lows that were hit earlier in that week. Now, another interesting pattern has been formed: a false breakout reversal below that 17170 support, confirmed by a diverging RSI. “From false breaks come fast moves in the opposite direction” is one of my favourite trading quotes and it certainly would have paid for anyone that took advantage of this recent fake breakout. As can be seen from the updated chart, the Nikkei has now surged higher and is up an impressive 1,300 points from the low it hit last Tuesday.
As things stand therefore, it looks like more short-term gains could be on the way for the Japanese index. There are now only a couple of key resistance levels that need to be watched from here until we arrive at that 19100 pivotal point; these being the 38.2% Fibonacci retracement level at 18465 and the September peak of 18770.
However traders with a longer term focus will be wary of the fact the index is still holding below the “death crossover” of the main moving averages (50 < 200 MA) and also below the support-turned-resistance around 19100. Until such a time that the Nikkei also breaks decisively above these levels, there is still the danger that this rally may prove to be another trap for the bulls. So proceed with extra care at this stage of the rally.
Figure 1:
Trading leveraged products such as FX, CFDs and Spread Bets carry a high level of risk which means you could lose your capital and is therefore not suitable for all investors. All of this website’s contents and information provided by Fawad Razaqzada elsewhere, such as on telegram and other social channels, including news, opinions, market analyses, trade ideas, trade signals or other information are solely provided as general market commentary and do not constitute a recommendation or investment advice. Please ensure you fully understand the risks involved by reading our disclaimer, terms and policies.
Recommended Content
Editors’ Picks
EUR/USD clings to daily gains above 1.0650

EUR/USD gained traction and turned positive on the day above 1.0650. The improvement seen in risk mood following the earlier flight to safety weighs on the US Dollar ahead of the weekend and helps the pair push higher.
GBP/USD recovers toward 1.2450 after UK Retail Sales data

GBP/USD reversed its direction and advanced to the 1.2450 area after touching a fresh multi-month low below 1.2400 in the Asian session. The positive shift seen in risk mood on easing fears over a deepening Iran-Israel conflict supports the pair.
Gold holds steady at around $2,380 following earlier spike

Gold stabilized near $2,380 after spiking above $2,400 with the immediate reaction to reports of Israel striking Iran. Meanwhile, the pullback seen in the US Treasury bond yields helps XAU/USD hold its ground.
Bitcoin Weekly Forecast: BTC post-halving rally could be partially priced in Premium

Bitcoin price shows no signs of directional bias while it holds above $60,000. The fourth BTC halving is partially priced in, according to Deutsche Bank’s research.
Week ahead – US GDP and BoJ decision on top of next week’s agenda

US GDP, core PCE and PMIs the next tests for the Dollar. Investors await BoJ for guidance about next rate hike. EU and UK PMIs, as well as Australian CPIs also on tap.
