![]()
In what’s been dubbed “Black Monday” yesterday, US stocks collapsed across the board, with the widely-watched Dow Jones Industrial Average (DJIA) of 30 massive US companies falling by over 1,000 points early in the session. Stocks did bounce from those panic lows, but the DJIA still closed the day down nearly 600 points, garnering top story treatment on the evening news across the US (and a bunch of panicked calls from my non-financially-inclined friends and family members).
After the selloff spilled back over into Asian markets, the People’s Bank of China (PBOC) decided to put its foot down and took action to try to stem the decline. The central bank cut interest rates for the fifth time in the last nine months, dropping the 1-year deposit and lending rates by 25bps to 1.75% and 4.6% respectively. The PBOC also cut its reserve requirement ratio (RRR), or the proportion of deposits that large Chinese banks must hold to protect against credit losses, by 0.5% to 18%.
The immediate economic impact of these moves is likely to be limited, but at least they show that global policymakers are concerned with the recent volatility and willing to step in. On that note, it’s worth noting that the PBOC had previously preferred to act over the weekend, when businesses and traders would have time to digest the move before the start of a new week; today’s midweek move may therefore carry more weight and help reassure jittery traders.
…So what’s next for US stocks?
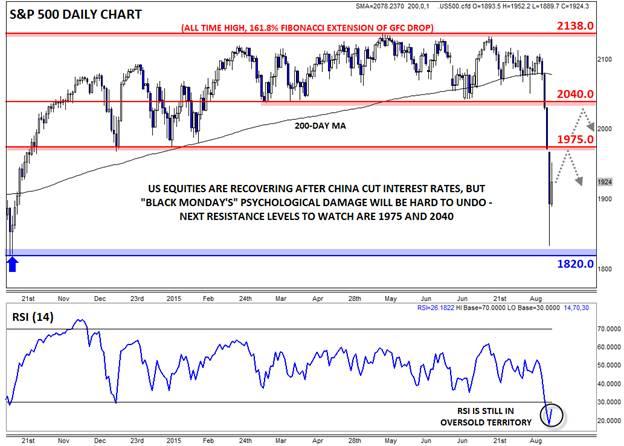
As of writing, the PBOC’s actions appears to have stabilized sentiment in equity markets. Most European markets closed higher by about 4% on the day, while US markets are trading up by 2-3% in afternoon trade. That said, Monday’s big drop did plenty of technical and psychological damage, so it’s important to take a step back and evaluate where we stand now.
Looking at the S&P 500, US-domiciled equities have regained the 1900 level, but still remain nearly 10% off the all-time highs above 2130, a level we tested just five weeks ago. The market consolidated in an extremely tight 1975-2140 range for the last 10 months, so there is plenty of overhead supply that could cap any near-term rallies. In other words, any traders who bought the S&P 500 in the last 10 months and is still holding are underwater on their position; as a result, they may be anxious to sell on any rallies back toward the previous consolidation zone.
For its part, the RSI indicator remains in oversold territory, so today’s bounce could easily extend further this week. Nonetheless, the damage has been done and the medium-term bias will remain bearish as long as the S&P 500 remains below the previous-support-turned-resistance levels at 1975 and 2040. Only a break back above 2040 would start to alleviate the deep psychological scars that traders have suffered over the last week.
Source: FOREX.com
General Risk Warning for stocks, cryptocurrencies, ETP, FX & CFD Trading. Investment assets are leveraged products. Trading related to foreign exchange, commodities, financial indices, stocks, ETP, cryptocurrencies, and other underlying variables carry a high level of risk and can result in the loss of all of your investment. As such, variable investments may not be appropriate for all investors. You should not invest money that you cannot afford to lose. Before deciding to trade, you should become aware of all the risks associated with trading, and seek advice from an independent and suitably licensed financial advisor. Under no circumstances shall Witbrew LLC and associates have any liability to any person or entity for (a) any loss or damage in whole or part caused by, resulting from, or relating to any transactions related to investment trading or (b) any direct, indirect, special, consequential or incidental damages whatsoever.
Recommended Content
Editors’ Picks
AUD/USD jumps above 0.6500 after hot Australian CPI data

AUD/USD extended gains and recaptured 0.6500 in Asian trading, following the release of hotter-than-expected Australian inflation data. The Australian CPI rose 1% in QoQ in Q1 against 0.8% forecast, providing extra legs to the Australian Dollar upside.
USD/JPY hangs near 34-year high at 154.88 as intervention risks loom

USD/JPY is sitting at a multi-decade high of 154.88 reached on Tuesday. Traders refrain from placing fresh bets on the pair as Japan's FX intervention risks loom. Broad US Dollar weakness also caps the upside in the major. US Durable Goods data are next on tap.
Gold price cautious despite weaker US Dollar and falling US yields

Gold retreats modestly after failing to sustain gains despite fall in US Treasury yields, weaker US Dollar. XAU/USD struggles to capitalize following release of weaker-than-expected S&P Global PMIs, fueling speculation about potential Fed rate cuts.
Crypto community reacts as BRICS considers launching stablecoin for international trade settlement

BRICS is intensifying efforts to reduce its reliance on the US dollar after plans for its stablecoin effort surfaced online on Tuesday. Most people expect the stablecoin to be backed by gold, considering BRICS nations have been accumulating large holdings of the commodity.
US versus the Eurozone: Inflation divergence causes monetary desynchronization

Historically there is a very close correlation between changes in US Treasury yields and German Bund yields. This is relevant at the current juncture, considering that the recent hawkish twist in the tone of the Fed might continue to push US long-term interest rates higher and put upward pressure on bond yields in the Eurozone.
