![]()
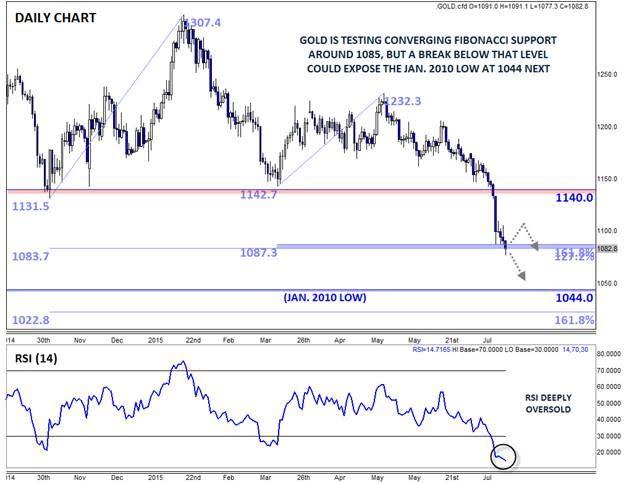
By far the biggest storyline in the markets this week has been the precipitous fall in the price of gold. After closing just below key support at the 1140 level last week, bullish traders panicked this week, driving the yellow metal down by a whopping 5% from last Friday’s close as of writing.
Interestingly, today’s drop has occurred despite a disappointing drop in China’s Markit Flash Manufacturing PMI data. The broad measure of manufacturing activity dropped to a 1-year low at 48.2, far below the essentially neutral 49.8 reading expected. In theory, this weak reading suggests that the People’s Bank of China (PBOC) may have to further expand its accommodative monetary policy, providing a possible bullish fundamental catalyst for gold. However, much like the Grexit and Chinese-stock-market-crash “crises” earlier this month, gold’s failure to bounce serves as a possible ominous warning sign for bulls.
Technical View
Turning our attention to the chart, gold is testing a critical support level around 1085. This zone represents the convergence of two Fibonacci extensions (the 127.2% extension of the November-January rally and the 161.8% extension of the March-May upswing), as well as the intraday lows on Monday and Wednesday. As we go to press, gold is peeking below that support zone, but it may be worth waiting for the weekly close before assuming that it’s been conclusively broken, especially given the deeply oversold daily RSI indicator.
If this level gives way, there’s not much in the way of support until the January 2010 low at 1044, followed by the 161.8% Fibonacci extension of the Nov-Jan rally at 1023. Even if we do see an oversold bounce off the 1085 area, medium-term traders are likely to fade that bounce as long as the metal holds below previous-support-turned-resistance at 1044.
This research is for informational purposes and should not be construed as personal advice. Trading any financial market involves risk. Trading on leverage involves risk of losses greater than deposits.
Recommended Content
Editors’ Picks
EUR/USD retreats below 1.0700 after US GDP data

EUR/USD came under modest bearish pressure and retreated below 1.0700. Although the US data showed that the economy grew at a softer pace than expected in Q1, strong inflation-related details provided a boost to the USD.
GBP/USD declines below 1.2500 as USD rebounds

GBP/USD declined below 1.2500 and erased the majority of its daily gains with the immediate reaction to the US GDP report. The US economy expanded at a softer pace than expected in Q1 but the price deflator jumped to 3.4% from 1.8%.
Gold holds near $2,330 despite rising US yields

Gold stays in positive territory near $2,330 in the second half of the day on Thursday. The benchmark 10-year US Treasury bond yield is up more than 1% on the day above 4.7% after US GDP report, making it difficult for XAU/USD to extend its daily rally.
XRP extends its decline, crypto experts comment on Ripple stablecoin and benefits for XRP Ledger

Ripple extends decline to $0.52 on Thursday, wipes out weekly gains. Crypto expert asks Ripple CTO how the stablecoin will benefit the XRP Ledger and native token XRP.
After the US close, it’s the Tokyo CPI

After the US close, it’s the Tokyo CPI, a reliable indicator of the national number and then the BoJ policy announcement. Tokyo CPI ex food and energy in Japan was a rise to 2.90% in March from 2.50%.
