![]()
Today was supposed to be the deadline for Iran and the P5+1 to reach a final agreement that would have limited Tehran’s nuclear programme in return for lifting its sanctions. However, it doesn’t appear as though anything will be agreed upon in time for the deadline, though the meetings are likely to continue for several more days nonetheless. Apparently there are several issues that stand in the way of an agreement, including the rights of nuclear inspectors entering military sites in Iran and that in the event of a deal, differences of opinion remain on the speed and timing of lifting the sanctions. Oil speculators who had opened some bearish positions in preparation for today’s deadline are probably trimming those positions, which could be one of the factors boosting Brent prices today. Needless to say, the oil market remains more than sufficiently supplied. If Iran were allowed to add to the excess, it is very likely that prices will have to fall and fall significantly.
Indeed, positioning data from the ICE, published on Monday, does suggest that the market is growing worried about a fall in oil prices as money managers withdrew from Brent for the seventh consecutive week. In the week to June 23, net long positions in the London-based oil contract fell by an additional 1,500 to 193,800 contracts. Net longs have now almost fallen 35% since hitting a record high in early May. Further sharp withdrawal of bullish positions from this group of market participant could really get the ball rolling.
As well as talks over Iran’s nuclear programme, the near term focus will now be on the latest US crude oil inventories data. Stockpiles are seen falling for the ninth consecutive week, this time by 4.9 million barrels. The American Petroleum institute (API)’s report will come ahead of the official data from the US Energy Information Administration (EIA) tomorrow afternoon.
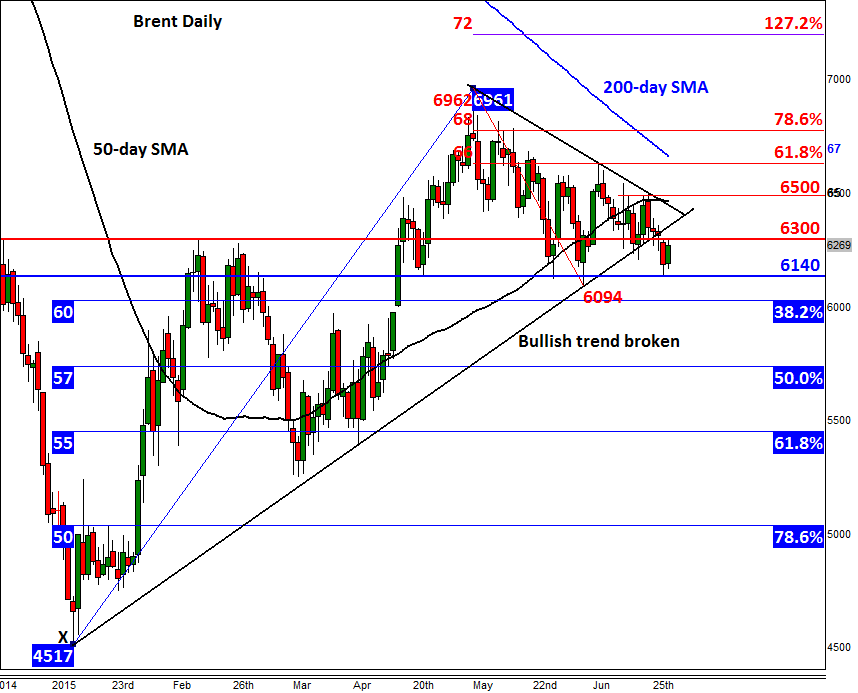
Technical outlook: Brent has broken uptrend
As we reported on Friday of last week, Brent’s upward sloping trend line was “looking shaky.†We mentioned that given the current fundamental backdrops, we wouldn’t be surprised if it broke down “even before we hear anything on Iran.†Indeed, this is exactly what has happened, with price also hitting our initial target and support at $61.40, before bouncing back. Brent is now testing the old support around $63.00. Given that the bullish trend has already been broken, this level could now turn into resistance – though a closing break above it could see price make a move towards the bearish trend at $64.50. As things stand, we remain bearish on Brent for as long as the bears defend the $65.00 resistance level. The next bearish target could be this month’s low of just below $61.00. Below $61.00 are the Fibonacci retracement levels at $60.30 (38.2%), $57.40 (50%) and then $54.50 (61.8%).
Trading leveraged products such as FX, CFDs and Spread Bets carry a high level of risk which means you could lose your capital and is therefore not suitable for all investors. All of this website’s contents and information provided by Fawad Razaqzada elsewhere, such as on telegram and other social channels, including news, opinions, market analyses, trade ideas, trade signals or other information are solely provided as general market commentary and do not constitute a recommendation or investment advice. Please ensure you fully understand the risks involved by reading our disclaimer, terms and policies.
Recommended Content
Editors’ Picks
AUD/USD could extend the recovery to 0.6500 and above

The enhanced risk appetite and the weakening of the Greenback enabled AUD/USD to build on the promising start to the week and trade closer to the key barrier at 0.6500 the figure ahead of key inflation figures in Australia.
EUR/USD now refocuses on the 200-day SMA

EUR/USD extended its positive momentum and rose above the 1.0700 yardstick, driven by the intense PMI-led retracement in the US Dollar as well as a prevailing risk-friendly environment in the FX universe.
Gold struggles around $2,325 despite broad US Dollar’s weakness

Gold reversed its direction and rose to the $2,320 area, erasing a large portion of its daily losses in the process. The benchmark 10-year US Treasury bond yield stays in the red below 4.6% following the weak US PMI data and supports XAU/USD.
Bitcoin price makes run for previous cycle highs as Morgan Stanley pushes BTC ETF exposure

Bitcoin (BTC) price strength continues to grow, three days after the fourth halving. Optimism continues to abound in the market as Bitcoiners envision a reclamation of previous cycle highs.
US versus the Eurozone: Inflation divergence causes monetary desynchronization

Historically there is a very close correlation between changes in US Treasury yields and German Bund yields. This is relevant at the current juncture, considering that the recent hawkish twist in the tone of the Federal Reserve might continue to push US long-term interest rates higher and put upward pressure on bond yields in the Eurozone.
