![]()
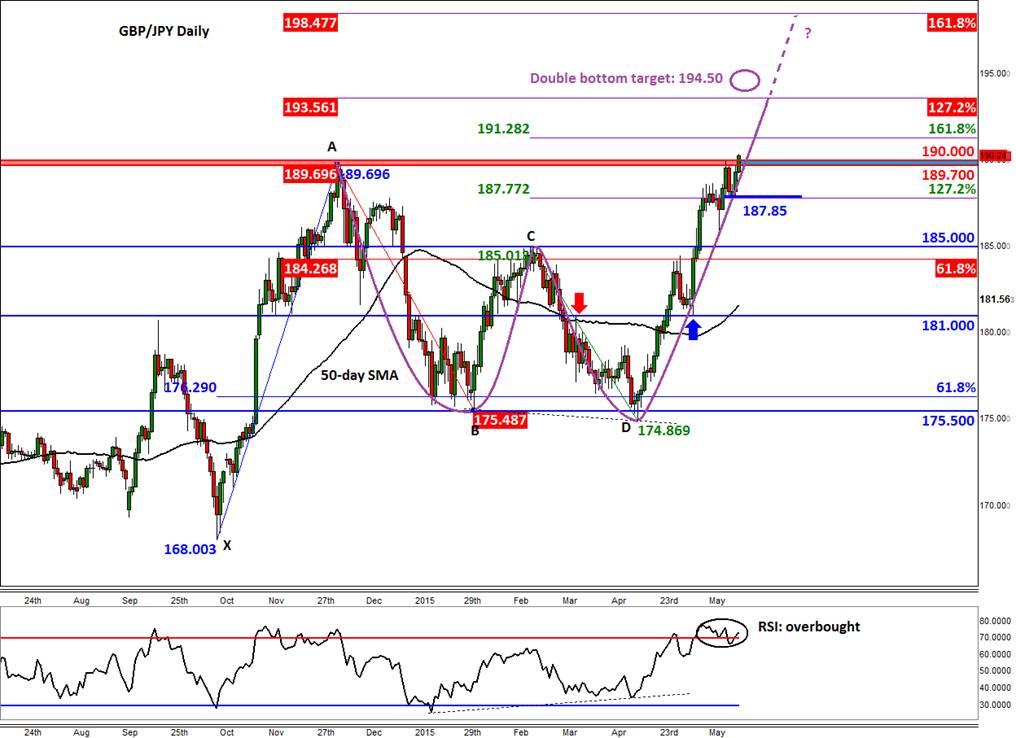
TheGBP/JPY last week peaked above the December high of 189.70, and for a time traded at its highest level since September 2008. But the pound sold off and subsequently the GBP/JPY fell back all the way to 187.85 before bouncing back. The cross has now recovered and it may go on to break out decisively at the second time of asking, particularly as the USD/JPY is also hitting fresh multi-year highs.
The GBP/JPY has already formed a major reversal pattern (a double bottom/false breakdown) in mid-April around 175.50, a price level which we had covered in our report on April 13. In the subsequent report on GBP/JPY published on May 11 we said the GBP/JPY “may have paved the way for a move to much higher levels…†after clearing the then key resistance level of 185.00. Thus, the move to “much higher†levels may already be in motion given these technical developments.
If the GBP/JPY does break above 189.70/190.00 decisively and post a daily closing above this area, then this may give rise to further follow-up technical buying which could pave the way for additional sharp gains in the near-term. As there is not much prior price reference points to watch on the GBP/JPY, this is where Fibonacci extension levels come handy. On the chart, below, we have plotted the extension levels of the past price swings from point A to B and from C to D. The first immediate Fibonacci target is at just shy of 191.30 which corresponds with the 161.8% extension of the CD swing. The more significant extension levels are further out at 193.55 and then 198.45 i.e. these are the 127.2 and 161.8 per cent extension levels of the AB swing. Fibonacci extension levels are used by some traders as objective profit targets. So, the rally could potentially fade around these levels as the longs take profit. In between the Fibonacci levels is the projected target of the double bottom pattern around 194.50. This is derived from adding the height of the pattern (i.e. 950 pips – the distance between point C and D) to the neckline at 185.00.
The bears meanwhile would like to see another failure at this 189.70/190.00 area. If seen, the GBP/JPY may pull back towards the 188.85 support level once. Though this scenario looks less likely, the rally does look a little bit over-stretched with the RSI above the overbought level of 70. However one can argue that this indicator is merely highlighting what we already know, which is that the bullish momentum has been strong. It is not too unusual for the RSI to remain overbought for extended periods of time during strong bullish trends.
Trading leveraged products such as FX, CFDs and Spread Bets carry a high level of risk which means you could lose your capital and is therefore not suitable for all investors. All of this website’s contents and information provided by Fawad Razaqzada elsewhere, such as on telegram and other social channels, including news, opinions, market analyses, trade ideas, trade signals or other information are solely provided as general market commentary and do not constitute a recommendation or investment advice. Please ensure you fully understand the risks involved by reading our disclaimer, terms and policies.
Recommended Content
Editors’ Picks
AUD/USD risks a deeper drop in the short term

AUD/USD rapidly left behind Wednesday’s decent advance and resumed its downward trend on the back of the intense buying pressure in the greenback, while mixed results from the domestic labour market report failed to lend support to AUD.
EUR/USD leaves the door open to a decline to 1.0600

A decent comeback in the Greenback lured sellers back into the market, motivating EUR/USD to give away the earlier advance to weekly tops around 1.0690 and shift its attention to a potential revisit of the 1.0600 neighbourhood instead.
Gold is closely monitoring geopolitics

Gold trades in positive territory above $2,380 on Thursday. Although the benchmark 10-year US Treasury bond yield holds steady following upbeat US data, XAU/USD continues to stretch higher on growing fears over a deepening conflict in the Middle East.
Bitcoin price shows strength as IMF attests to spread and intensity of BTC transactions ahead of halving

Bitcoin (BTC) price is borderline strong and weak with the brunt of the weakness being felt by altcoins. Regarding strength, it continues to close above the $60,000 threshold for seven weeks in a row.
Is the Biden administration trying to destroy the Dollar?

Confidence in Western financial markets has already been shaken enough by the 20% devaluation of the dollar over the last few years. But now the European Commission wants to hand Ukraine $300 billion seized from Russia.
