![]()
The FTSE has started the new month little-changed following a sharp drop at the end of April. Despite the late sell-off, the UK index managed to end the month with a gain of about 2.5%. In contrast, the S&P 500 only managed a gain of about 1% over the month while the German DAX index ended almost 4.5% worse off. To some degree, the FTSE’s relatively better performance last month was due to the rebounding oil prices which lifted energy stocks, a sector which had previously weighed on the commodity-heavy index. Also supporting the FTSE has been the mixed-bag UK company earnings and a somewhat positive sentiment on Wall Street thanks to mostly better results there. European shares in contrast were helped lower in part by a rebounding euro which undermined stocks of export-oriented companies – most notably in Germany – and continued uncertainty over the future of Greece.
But now we are in the month of May in which the oft-quoted phrase “sell in May and go away” may play at the back of some investors’ minds and thus discourage them from adding to their positions. Indeed the start of this month could be a tricky one for those who would like to invest in the UK markets due to the growing uncertainty about the country’s political situation. Just one week to go until the general election, opinion polls point to a hung parliament. With the major party leaders having ruled out various coalitions, no one knows for sure who will govern Britain as it could involve several parties this time.
As far as today is concerned, the UK index is slightly higher, boosted by commodity stocks after PMI data overnight showed that manufacturing activity in China just about remained in the expansionary territory in April, as it printed 50.1 (50.0 was expected). The Chinese non-manufacturing PMI was weaker as it fell to 53.4 from 53.7. Meanwhile here in the UK, activity in the manufacturing sector fell to a seven month low in April, suggesting the economy started Q2 on the back foot. The PMI was 51.9 versus 54.6 expected and 54.4 in March. The UK’s lending data was mixed as net lending to individuals rose to £3.1bn in March versus £2.6bn expected, while the number of mortgage approvals fell to 61,000 applications from 62,000 the month prior. Among the individual stocks making the headlines was Lloyds whose stock has rallied more than 6 per cent after posting a 21% increase in underlying profit.
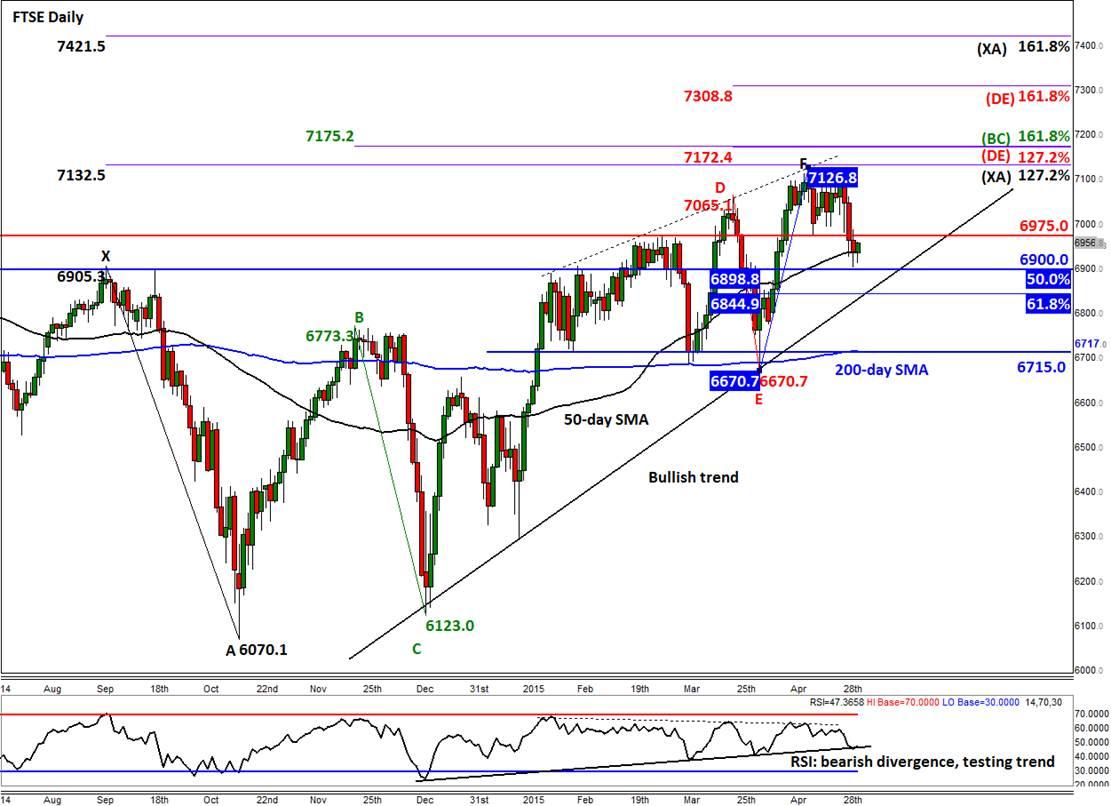
From a technical point of view, the near term direction of the FTSE remains unclear although encouragingly for the bulls, the index has found some support for a second day just ahead of the 6900 level. It is important to remember the significance of 6900. Traders may recall that this had been a major resistance area in the past. Now that it has been broken, this level is a primary reference point for the bullish speculators and is in their interest to defend it. That said however the significance of 6900 has been eroded somewhat after the whipsaw we saw in March. Nevertheless the index has bounced back today and the technical outlook is on the verge of turning back bullish. This depends to some degree on whether the buyers will be able to push the FTSE above the broken support at 6975 and hold there on a closing basis. If successful, the path of least resistance would be to the upside once more. This may then pave the way for a potential move towards the Fibonacci extension levels at virgin territories, shown on the daily chart.
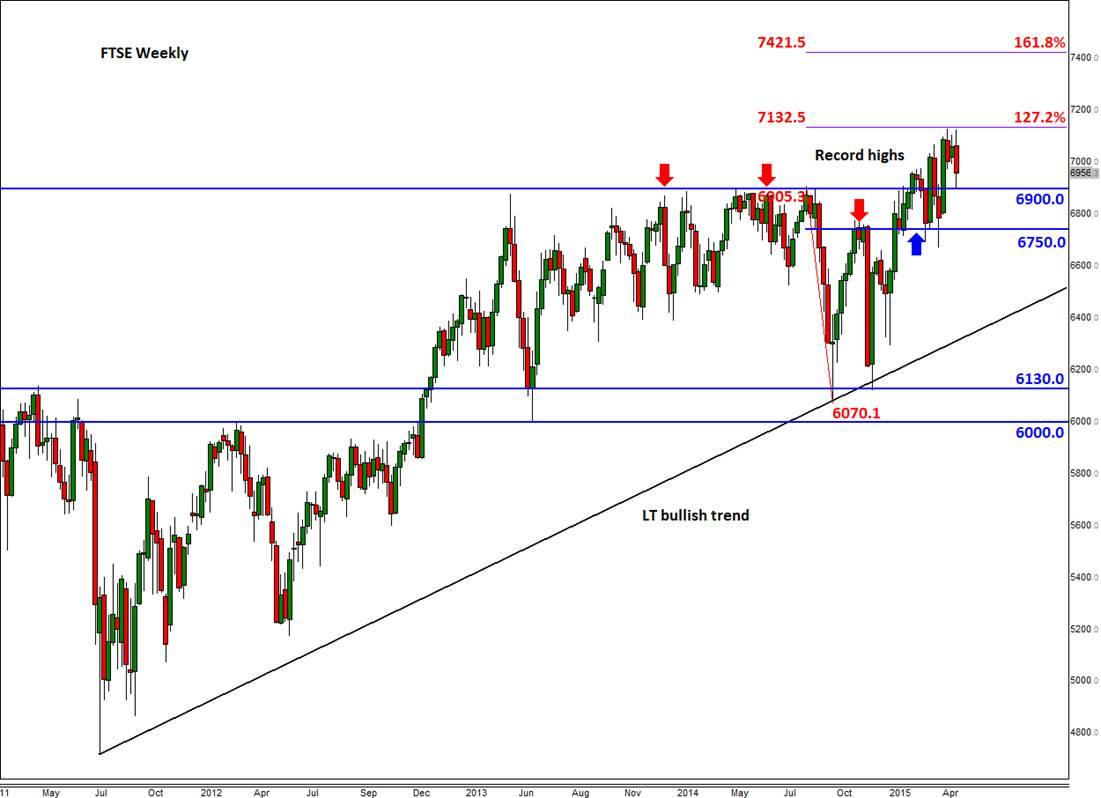
However, there is no guarantee that the index will break back above the old support at 6975 and even if it does, the potential follow-up technical buying may not be that strong. After all, the RSI is clearly in a state of bearish divergence with the index, correctly suggesting that the bullish momentum has been weakening. The RSI is now testing its bullish trend and if it were to break this then it may precede the underlying FTSE index doing the same. The trend line on the FTSE comes in somewhere around 6845. Significantly, this level also corresponds with the important Fibonacci retracement level of 61.8%. Thus, a potential break below it may lead to a much larger correction towards at least the 200-day moving average at 6715 and possibly towards the long-term bullish trend that is visible on the weekly chart.
Figure 1:
Figure 2:
Trading leveraged products such as FX, CFDs and Spread Bets carry a high level of risk which means you could lose your capital and is therefore not suitable for all investors. All of this website’s contents and information provided by Fawad Razaqzada elsewhere, such as on telegram and other social channels, including news, opinions, market analyses, trade ideas, trade signals or other information are solely provided as general market commentary and do not constitute a recommendation or investment advice. Please ensure you fully understand the risks involved by reading our disclaimer, terms and policies.
Recommended Content
Editors’ Picks
AUD/USD stand firm above 0.6500 with markets bracing for Aussie PPI, US inflation

The Aussie Dollar begins Friday’s Asian session on the right foot against the Greenback after posting gains of 0.33% on Thursday. The AUD/USD advance was sponsored by a United States report showing the economy is growing below estimates while inflation picked up. The pair traded at 0.6518.
USD/JPY climbs relentlessly ahead of BoJ meeting

The USD/JPY extends its uptrend despite verbal intervention from the Minister of Finance. The wide differential between US and Japanese interest rates is seen as a major factor contributing to the rise. The idea that a lot is already priced into the US Dollar could limit USD/JPY upside.
Gold holds around $2,330 after dismal US data

Gold fell below $2,320 in the early American session as US yields shot higher after the data showed a significant increase in the US GDP price deflator in Q1. With safe-haven flows dominating the markets, however, XAU/USD reversed its direction and rose above $2,340.
Bitcoin price continues to get rejected from $65K resistance as SEC delays decision on spot BTC ETF options

Bitcoin (BTC) price has markets in disarray, provoking a broader market crash as it slumped to the $62,000 range on Thursday. Meanwhile, reverberations from spot BTC exchange-traded funds (ETFs) continue to influence the market.
US economy: slower growth with stronger inflation

The dollar strengthened, and stocks fell after statistical data from the US. The focus was on the preliminary estimate of GDP for the first quarter. Annualised quarterly growth came in at just 1.6%, down from the 2.5% and 3.4% previously forecast.

