![]()
Crude oil is trading higher on this last trading day of the week and the month. At a good $61 a barrel, Brent is also higher on the week but WTI is down as it hovers around the $49 level. The price differential between these two oil contracts has therefore grown to $12, the widest since January 2014.
The widening of the price gap in part reflects the fact that the US oil output has continued to grow relentlessly despite the much weaker prices recently. This has helped to push crude stockpiles to repeated all-time highs, which more or less confirms that the market is still oversupplied. As the Energy Information Administration’s (EIA) latest data shows, crude inventories grew by some 8.4 million barrels last week. This was the seventh consecutive weekly increase; stocks have grown by more than 50 million barrels during this time, pushing the total to 434.1 million barrels. However there was some good news as both gasoline and distillate stocks decreased sharply last week, by a good 3.1 and 2.7 million barrels respectively. This actually caused WTI oil prices to recover somewhat in mid-week and prevented a larger decline for the week as a whole. Meanwhile, the current economic conditions do not point to a marked improvement in oil demand, so any notable recovery that we may see will mostly be due to the supply side of the equation. On this front, Baker Hughes’ rig count data, released on Fridays, and the usual weekly inventories reports, on Tuesdays and Wednesdays, will be among the best indicators about the future production levels. Last week, the falls in rig counts were noticeably lower compared to recent times. If this trend continues then WTI may struggle to recover much further than it already has, as nothing has been done about the supply glut in the short-term which continues to exert strong downward pressure on prices.
In contrast, Brent looks more constructive. There seems to be some disquiet among the OPEC after Nigeria’s oil minister, Diezani Alison-Madueke, who is also the current president of the OPEC, recently said that further price volatility would make it “highly likely that I will have to call an extraordinary meeting of OPEC in the next six weeks or so.” This has increased speculation that the cartel may after all cut back its production quota and thus concede some market share to shale producers. However if this is dismissed, Brent could potentially fall back significantly as investors price out the probability of a production cut.
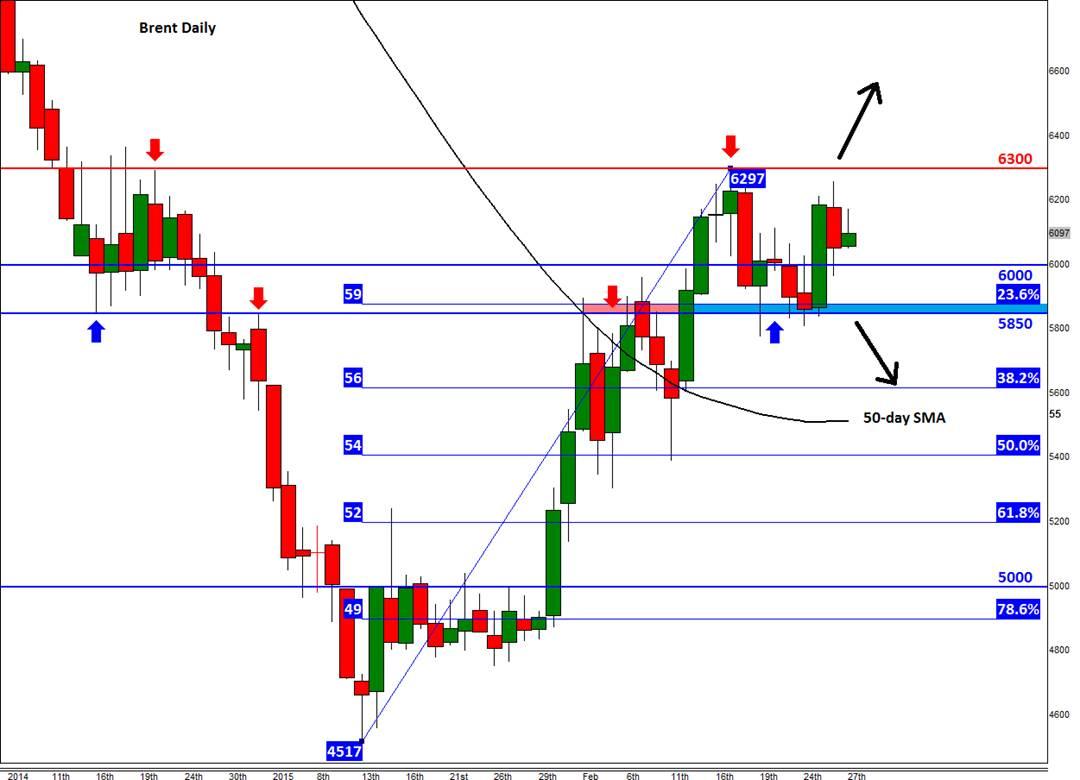
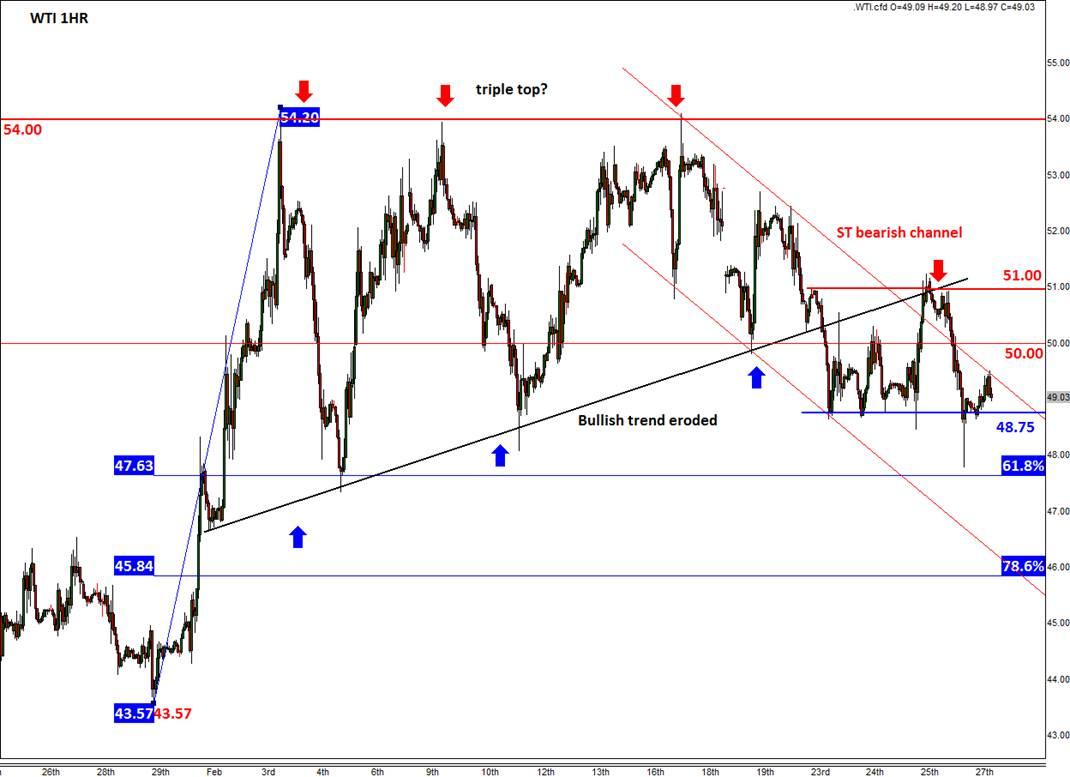
The daily chart of Brent shows a potentially technical bullish development following this week’s rally off the $58.50/$59.00 support area. As can be seen, this area was previously resistance and it also corresponds with the 23.6% Fibonacci retracement level of the recent upswing. As this is a particularly shallow retracement level, it points to potentially large gains IF resistance around $63.00 breaks. However if the bears win this particular battle then we may see a sizeable pullback towards some of the support levels shown on the chart, with the first such level being the 38.2% retracement at just above $56. Meanwhile the 1-hour chart of WTI shows a completely different picture. After creating a triple top reversal pattern early last week at $54.00, it has generally traded lower inside a short-term bearish channel. Though it has found some support around $48.75, the short-term bias would only turn bullish upon a break above resistance at $51.
Trading leveraged products such as FX, CFDs and Spread Bets carry a high level of risk which means you could lose your capital and is therefore not suitable for all investors. All of this website’s contents and information provided by Fawad Razaqzada elsewhere, such as on telegram and other social channels, including news, opinions, market analyses, trade ideas, trade signals or other information are solely provided as general market commentary and do not constitute a recommendation or investment advice. Please ensure you fully understand the risks involved by reading our disclaimer, terms and policies.
Recommended Content
Editors’ Picks
EUR/USD clings to daily gains above 1.0650

EUR/USD gained traction and turned positive on the day above 1.0650. The improvement seen in risk mood following the earlier flight to safety weighs on the US Dollar ahead of the weekend and helps the pair push higher.
GBP/USD recovers toward 1.2450 after UK Retail Sales data

GBP/USD reversed its direction and advanced to the 1.2450 area after touching a fresh multi-month low below 1.2400 in the Asian session. The positive shift seen in risk mood on easing fears over a deepening Iran-Israel conflict supports the pair.
Gold holds steady at around $2,380 following earlier spike

Gold stabilized near $2,380 after spiking above $2,400 with the immediate reaction to reports of Israel striking Iran. Meanwhile, the pullback seen in the US Treasury bond yields helps XAU/USD hold its ground.
Bitcoin Weekly Forecast: BTC post-halving rally could be partially priced in Premium

Bitcoin price shows no signs of directional bias while it holds above $60,000. The fourth BTC halving is partially priced in, according to Deutsche Bank’s research.
Week ahead – US GDP and BoJ decision on top of next week’s agenda

US GDP, core PCE and PMIs the next tests for the Dollar. Investors await BoJ for guidance about next rate hike. EU and UK PMIs, as well as Australian CPIs also on tap.

