![]()
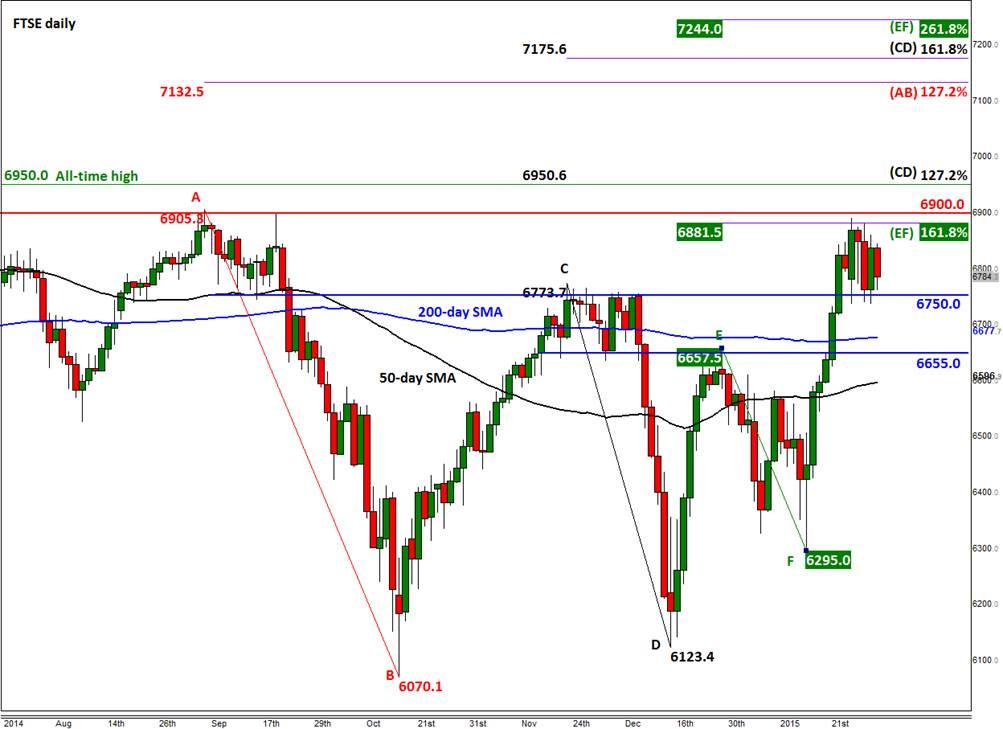
After a strong rally from mid-January, thanks in part to the actions of the ECB, the FTSE is now consolidating near the multi-year resistance hurdle of 6900. The consolidation near this 6900 barrier does not surprise us; after all, this is not the first time we have seen the market hesitate here. In fact, this level has provided resistance for a good 2.5 years now. Investors are probably waiting for fresh stimulus to provide them the confidence needed to increase their bullish bets. They are probably also asking themselves how the much-lower oil price, the weaker euro and a significantly looser monetary policy will actually translate into economic growth in Europe. Judging by the actions of the Bank of Japan – where the use of unconventional monetary policy has only had limited impact so far, as highlighted for example by the weaker-than-expected Japanese data that were released overnight – monetary policy alone cannot solve all the fundamental problems in an economy. That said, the Fed has apparently been more successful in this regard. Whether the ECB will achieve a similar outcome as the Fed remains to be seen. For now though, investors are giving the ECB the benefit of the doubt, which is why the likes of the German DAX index has done particularly well of late. Will the FTSE follow suit and finally break through the 6900 barrier and stage a similar rally? This will depend, at least to some degree, on the general outcome of the UK quarterly earnings season that is now underway. Next week we will witness a glut of UK earnings, which include among others BP and Ocado on Tuesday; Sky, GSK and Hargreaves Lansdowne on Wednesday, and Smith & Nephew and AstraZeneca on Friday. In addition, there will be more earnings numbers from the US and also from Europe, too. Furthermore, there will be lots of economic data to look forward to next week, not least the global manufacturing PMIs and the all-important US monthly jobs report.
Technical outlook
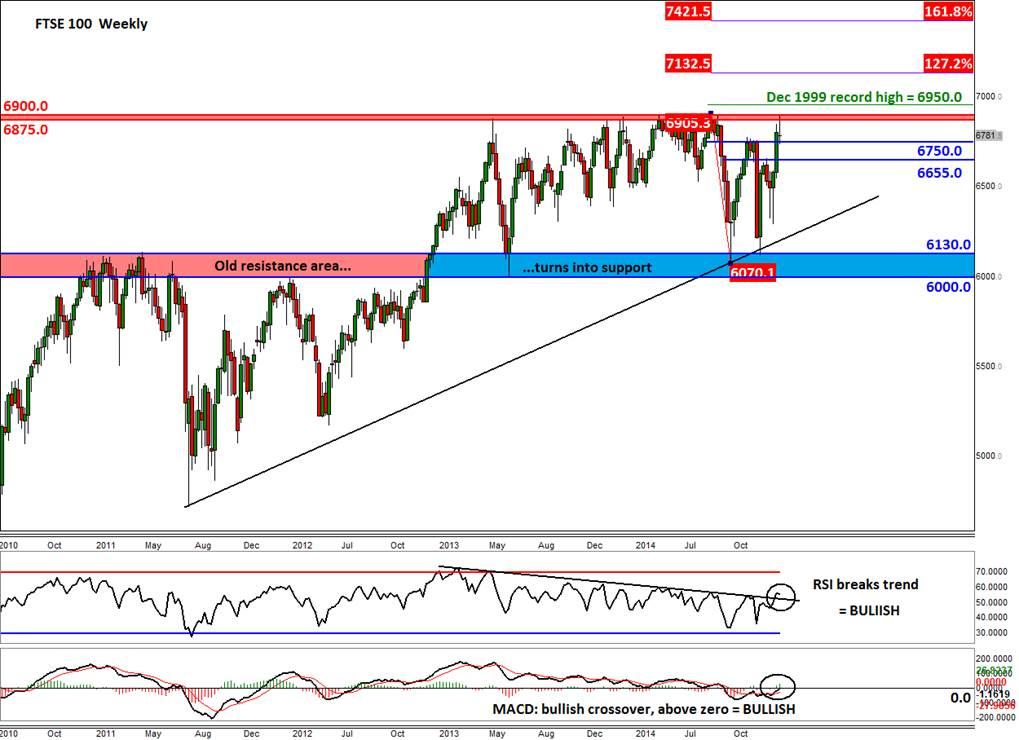
As mentioned above, the FTSE is consolidating below that 6900 hurdle again following the recent recovery. In fact technically speaking it has been consolidating below this handle for a good 2.5 years now, although inside this consolidative phase it has created a couple of higher lows with the first being around 6125, made in December, and the second at 6295, hit earlier this month. More significantly, the index has also managed to hold its own above the key 6000-6130 support region, which was a major resistance area in the past (see the weekly chart). Thus the long-term bullish trend has been maintained even though the index has moved mostly sideways for the best part of the past two years. Consequently, some of the long-term momentum indicators are now showing bullish signs: the weekly RSI for one has broken above its bullish trend while the MACD has created a bullish crossover and is back above the key zero level.
So, the FTSE may be gearing up for a potential breakout. If it does go on to climb and hold above 6900 soon, as the aforementioned technical indicators suggests it might, then this would be a major technical development in the long term which could see the index rally to fresh all-time highs and towards the Fibonacci extension levels shown on the two charts below. All that said however, there’s still a good chance the FTSE may once again falter at 6900. So, it is important to watch support at 6750/75 closely. Only a closing break below this range would signal the end of the short-term bullish trend. But even then, the potential pullback could be limited to the next support area around 6655/75 (old resistance & 200-day moving average).
Trading leveraged products such as FX, CFDs and Spread Bets carry a high level of risk which means you could lose your capital and is therefore not suitable for all investors. All of this website’s contents and information provided by Fawad Razaqzada elsewhere, such as on telegram and other social channels, including news, opinions, market analyses, trade ideas, trade signals or other information are solely provided as general market commentary and do not constitute a recommendation or investment advice. Please ensure you fully understand the risks involved by reading our disclaimer, terms and policies.
Recommended Content
Editors’ Picks
EUR/USD clings to daily gains above 1.0650

EUR/USD gained traction and turned positive on the day above 1.0650. The improvement seen in risk mood following the earlier flight to safety weighs on the US Dollar ahead of the weekend and helps the pair push higher.
GBP/USD recovers toward 1.2450 after UK Retail Sales data

GBP/USD reversed its direction and advanced to the 1.2450 area after touching a fresh multi-month low below 1.2400 in the Asian session. The positive shift seen in risk mood on easing fears over a deepening Iran-Israel conflict supports the pair.
Gold holds steady at around $2,380 following earlier spike

Gold stabilized near $2,380 after spiking above $2,400 with the immediate reaction to reports of Israel striking Iran. Meanwhile, the pullback seen in the US Treasury bond yields helps XAU/USD hold its ground.
Bitcoin Weekly Forecast: BTC post-halving rally could be partially priced in Premium

Bitcoin price shows no signs of directional bias while it holds above $60,000. The fourth BTC halving is partially priced in, according to Deutsche Bank’s research.
Week ahead – US GDP and BoJ decision on top of next week’s agenda

US GDP, core PCE and PMIs the next tests for the Dollar. Investors await BoJ for guidance about next rate hike. EU and UK PMIs, as well as Australian CPIs also on tap.

