![]()
The European stock markets are lower for a second consecutive session, which I think is driven mainly by speculators taking profit on their long positions opened in the run up to and after the ECB’s policy decision last week. Granted, the so-called ‘Grexit’ fears are back as the new Greek PM Tsipras seems determined to re-negotiate bailout terms for his country in a bid to relieve austerity. This has driven the yield on the benchmark government debt above 10% which is the highest since early January. However, there are currently little or no signs to suggest contagion is spreading to other Eurozone nations, for if there were the euro would surely be falling along with the stock markets. In fact, the single currency is holding up relatively well after bouncing back this week. Meanwhile the situation concerning Russia and Ukraine has been in the headlines for a long period of time now. So threats that the EU is preparing for more sanctions on Russia are unlikely to cause a major aversion in risk. That said, it will probably give traders more reason to reduce their exposure in equities in the short term. Nevertheless, once this phase of profit-taking is over, European stocks are likely to extend their recent gains and rally to fresh multi-year or all-time highs. The ECB’s bond buying programme is likely to drive benchmark bond yields further lower going forward, which may in turn encourage investors to move funds into riskier assets such as stocks. Meanwhile the robust earnings figures from Apple may boost Wall Street today and this could help soothe sentiment in Europe, too.
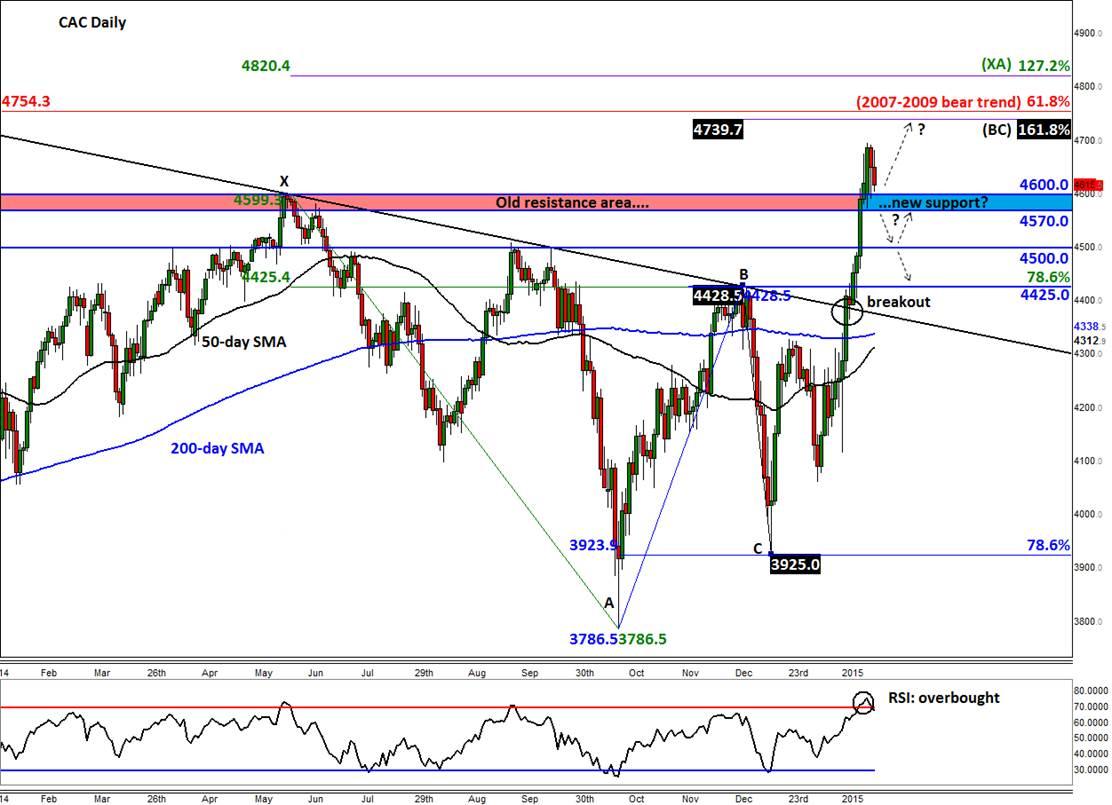
France’s CAC 40 currently appears the most technically-friendly index among its European peers. As I go to press, it is hovering around a key technical area between 4570 and 4600. The upper end of this range was the high from last year while the lower end marks the low from Monday’s session. So there is a potential for a sharp move in their direction from here. A potential break below 4570 could send the index tumbling towards the next support at 4500 or even lower still at 4425. This would also be psychological blow for the bulls as it would indicate that they lacked conviction to buy at these fresh multi-year highs. Meanwhile the RSI has already climbed above the overbought threshold of >70 a couple of days ago. This suggests that the bullish momentum may be weakening somewhat, which is not entirely surprising given the extent of the recent rally.
However, if the buyers manage to hold their ground at these levels then we may see a quick rally towards the Fibonacci levels shown on the chart. These are the 161.8% extension of the most recent downswing from point B to C, at 4740; the 127.2% extension of the downswing from the 2014 high (move from point X to A), at 4820, and the long-term 61.8% retracement of the bear move from 2007 to 2009, at 4755.
Given that the likes of the DAX and Dow are trading at or near record highs, and the FTSE is not too far from its all-time peak, the CAC is clearly lagging behind as it has only recently made back 50% of the losses suffered during the financial crisis. But with the ECB determined to create inflation by pumping money into the financial markets, the likes of the CAC and IBEX could start to outperform as they play catch up. For this reason, my long-term outlook is rather bullish on the CAC and European stocks in general.
Trading leveraged products such as FX, CFDs and Spread Bets carry a high level of risk which means you could lose your capital and is therefore not suitable for all investors. All of this website’s contents and information provided by Fawad Razaqzada elsewhere, such as on telegram and other social channels, including news, opinions, market analyses, trade ideas, trade signals or other information are solely provided as general market commentary and do not constitute a recommendation or investment advice. Please ensure you fully understand the risks involved by reading our disclaimer, terms and policies.
Recommended Content
Editors’ Picks
AUD/USD failed just ahead of the 200-day SMA

Finally, AUD/USD managed to break above the 0.6500 barrier on Wednesday, extending the weekly recovery, although its advance faltered just ahead of the 0.6530 region, where the key 200-day SMA sits.
EUR/USD met some decent resistance above 1.0700

EUR/USD remained unable to gather extra upside traction and surpass the 1.0700 hurdle in a convincing fashion on Wednesday, instead giving away part of the weekly gains against the backdrop of a decent bounce in the Dollar.
Gold keeps consolidating ahead of US first-tier figures

Gold finds it difficult to stage a rebound midweek following Monday's sharp decline but manages to hold above $2,300. The benchmark 10-year US Treasury bond yield stays in the green above 4.6% after US data, not allowing the pair to turn north.
Bitcoin price could be primed for correction as bearish activity grows near $66K area

Bitcoin (BTC) price managed to maintain a northbound trajectory after the April 20 halving, despite bold assertions by analysts that the event would be a “sell the news” situation. However, after four days of strength, the tables could be turning as a dark cloud now hovers above BTC price.
Bank of Japan's predicament: The BOJ is trapped

In this special edition of TradeGATEHub Live Trading, we're joined by guest speaker Tavi @TaviCosta, who shares his insights on the Bank of Japan's current predicament, stating, 'The BOJ is Trapped.'
