![]()
The ECB day is finally here and the stock markets are relatively calm as investors await confirmation from the central bank itself. It could be the calm before the storm once the policy statement is released at 12:45 GMT and during the press conference at 13:30. Yesterday’s media reports suggested that the ECB is considering a quantitative easing programme of €50bn a month through to 2016. If true, this would thus be equivalent to €600 billion a year and up to €1.1 trillion until December 2016, depending on the starting date. It would also be significantly more than the previously-reported €500bn, which, if confirmed, could see the markets stage another sharp rally. That said, the market has priced in at least a €500bn stimulus programme, so anything less could lead to a correction of some sort (more on ECB HERE).
Greece worries could come back to forefront
Once the ECB is out of the way, the market’s focus is likely to shift to the Greek elections on Sunday. Although “Grexit†worries have been put to the back burner, they could come back to the forefront as early as Monday if the Greeks choose to elect the anti-austerity Syriza party into power. So, it could be that investors are underestimating the risks of Greece eventually exiting the euro zone. That said, the leader of Syriza has changed tack recently; instead of forcing his country to exit the Eurozone, he has instead promised to negotiate the terms of the bailout if he wins. Although the German’s have been vocal in their opposition for negotiation, the feeling in the market is that they may have to come to a compromise should Syriza win because the Eurozone is still better off with rather than without Greece. On top of this, it is widely believed that a vast majority of the European companies that were previously heavily exposed to Greece, have now reduced their exposure and are therefore better papered for its potential exit. Nevertheless, European banks such as France’s BNP Paribas, Credit Agricole and SocGen may still have some direct and indirect exposure to the troubled nation. This could potentially halt the CAC’s rally.
Technical outlook
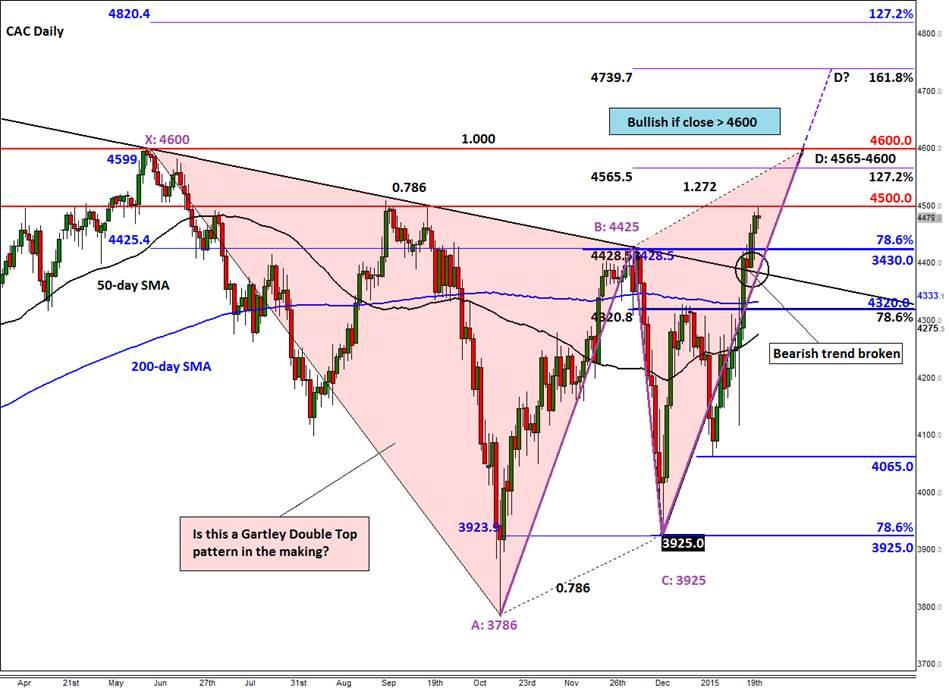
The French benchmark CAC index has been technically-friendly of late. As can be seen on the chart, it has responded particularly well to the 78.6% Fibonacci retracement levels of the past three major price swings. This has helped us to identify a developing Fibonacci-based pattern: a Gartley Double Top, which also incorporates an AB=CD pattern. However, for the index to get to point D around 4665-4600, which is where this pattern suggests the market may top, it will have to break above resistance at 4500 which it is currently struggling to do so. Nevertheless, it has already taken out an 8-month old bearish trend line and old resistance at 3430, so the path of least resistance is to the upside. The old resistance at 3430 could turn into a near-term support level. Thus, should the index break below it at some stage in the very near term, a move down to the next support at 4320 could be on the cards. Meanwhile a potential break above 4600, which was the 2014 high, could pave the way for some significant gains in the coming weeks and months. In his case, the bulls’ initial targets could be the Fibonacci extension levels at 4740 (161.8% of BC) followed by 4820 (127.2% of XA).
Trading leveraged products such as FX, CFDs and Spread Bets carry a high level of risk which means you could lose your capital and is therefore not suitable for all investors. All of this website’s contents and information provided by Fawad Razaqzada elsewhere, such as on telegram and other social channels, including news, opinions, market analyses, trade ideas, trade signals or other information are solely provided as general market commentary and do not constitute a recommendation or investment advice. Please ensure you fully understand the risks involved by reading our disclaimer, terms and policies.
Recommended Content
Editors’ Picks
US economy grows at an annual rate of 1.6% in Q1 – LIVE

The US' real GDP expanded at an annual rate of 1.6% in the first quarter, the US Bureau of Economic Analysis' first estimate showed on Thursday. This reading came in worse than the market expectation for a growth of 2.5%.
EUR/USD retreats to 1.0700 after US GDP data

EUR/USD came under modest bearish pressure and retreated to the 1.0700 area. Although the US data showed that the economy grew at a softer pace than expected in Q1, strong inflation-related details provided a boost to the USD.
GBP/USD declines below 1.2500 with first reaction to US data

GBP/USD declined below 1.2500 and erased a portion of its daily gains with the immediate reaction to the US GDP report. The US economy expanded at a softer pace than expected in Q1 but the price deflator jumped to 3.4% from 1.8%.
Gold falls below $2,330 as US yields push higher

Gold came under modest bearish pressure and declined below $2,330. The benchmark 10-year US Treasury bond yield is up more than 1% on the day after US GDP report, making it difficult for XAU/USD to extend its daily recovery.
XRP extends its decline, crypto experts comment on Ripple stablecoin and benefits for XRP Ledger

Ripple extends decline to $0.52 on Thursday, wipes out weekly gains. Crypto expert asks Ripple CTO how the stablecoin will benefit the XRP Ledger and native token XRP.
