![]()
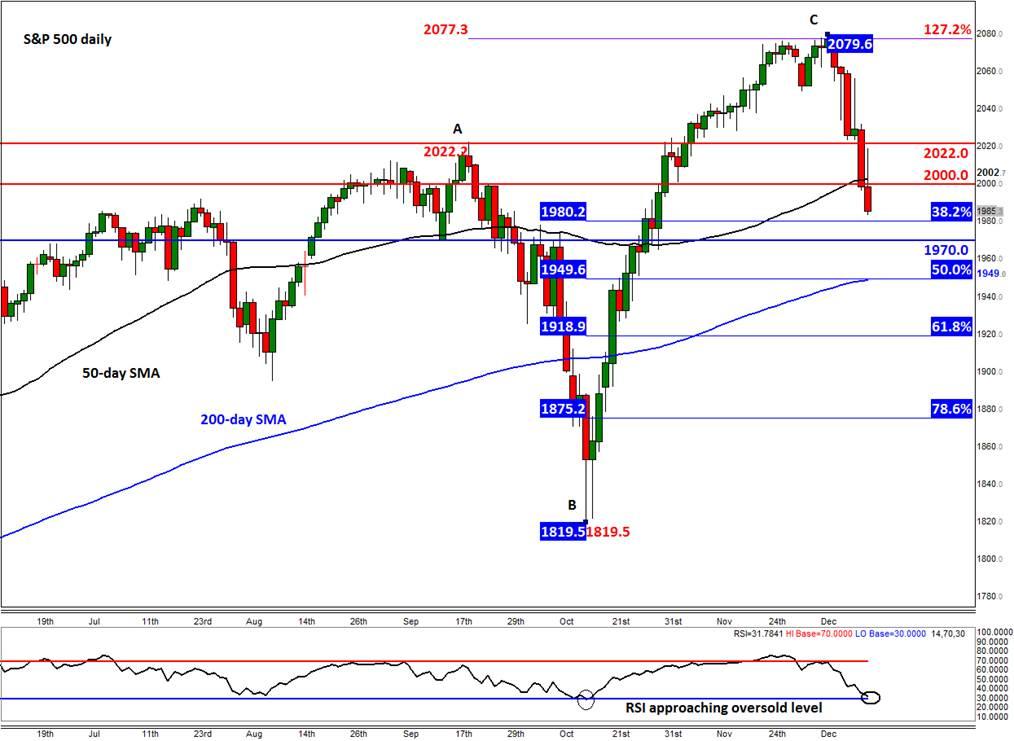
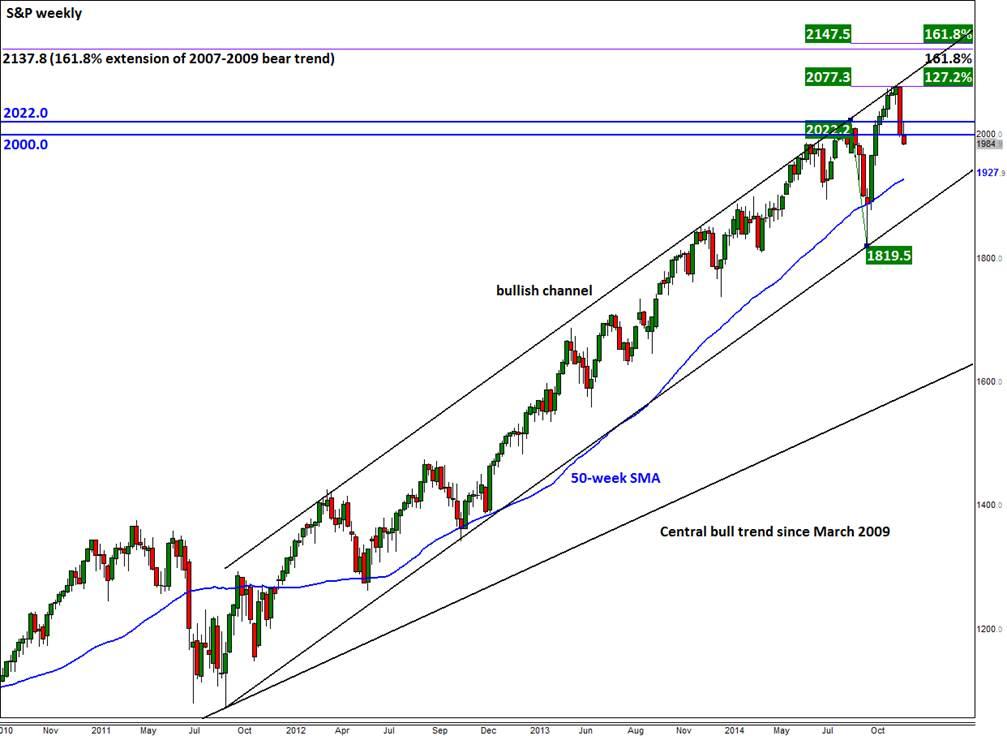
The S&P 500 is continuing to fall after reaching the upper resistance trend of its long-term bullish channel a couple of weeks ago at just shy of 2080. From that peak, it has now dropped by a good 95 points, or 4.6 per cent, so far. Today, it has even dropped below our second bearish target of 2000, taking the 50-day moving average out it the process. As we mentioned on Friday, the break below this level has now potentially paved the way for further follow-up technical selling. The possibility that the S&P could now drop all the way to the support trend of its long-term bullish channel around 1875 has increased. But ahead of 1875 there are several other key technical levels that may also hold as support, in particular the Fibonacci retracements of the rally from mid-October. The 38.2% retracement comes in at 1980 while the 61.8% sits at 1919. In between these levels is the 50% retracement at 1950 which also converges with the 200-day moving average. Further lower still is the 78.6% retracement at 1875; as mentioned, this also converges with the support trend of the long-term bullish channel.
Meanwhile the momentum indicator RSI is now fast approaching the oversold levels on the daily time frame. The last time the RSI reached 20, we saw a subsequent rally in the underlying S&P index. Are we going to see a similar pattern this time? That’s a million dollar question, but just because the index is oversold it does not necessarily mean it will or should bounce back. If in doubt, take a quick look at a chart of crude oil with an RSI indicator on it! What’s more, the last time the RSI hit 20, it corresponded with the S&P also reaching the support trend of its own long-term bullish channel. In other words, the probability for a bounce was higher then compared to now. Indeed, as can be seen, this time the index is miles away from that same trend line, although again this does not necessarily mean it will reach the trend line before bouncing back. The market could bounce back at any moment in time and no one knows for sure when this will be. Saying otherwise implies that one knows exactly what each individual trader in the world is thinking and not only that but he/she also has the confidence that all of those traders will act on their thoughts (i.e. by putting the trades on)! But again, that doesn’t mean one cannot predict where the market may turn and get it right. In fact, by lightening potential support levels, that’s exactly what I am trying to do here. But those are potential supports and even if the market bounces from any of those levels that is not to say the market will have bottomed. As a side note, that’s why it is important traders should take partial profit at key support or resistance levels when the market makes money available!
Anyway, given the extent and speed of the recent falls, the probability for a bounce has increased. But until and unless we see a clear reversal sign – such as a completed bullish engulfing candle of the daily chart, or a similar pattern – the path of least resistance remains to the downside as things stand.
Figure 1:
Source: FOREX.com. Please note this product is not available to US clients.
Source 2:
Source: FOREX.com. Please note this product is not available to US clients.
General Risk Warning for stocks, cryptocurrencies, ETP, FX & CFD Trading. Investment assets are leveraged products. Trading related to foreign exchange, commodities, financial indices, stocks, ETP, cryptocurrencies, and other underlying variables carry a high level of risk and can result in the loss of all of your investment. As such, variable investments may not be appropriate for all investors. You should not invest money that you cannot afford to lose. Before deciding to trade, you should become aware of all the risks associated with trading, and seek advice from an independent and suitably licensed financial advisor. Under no circumstances shall Witbrew LLC and associates have any liability to any person or entity for (a) any loss or damage in whole or part caused by, resulting from, or relating to any transactions related to investment trading or (b) any direct, indirect, special, consequential or incidental damages whatsoever.
Recommended Content
Editors’ Picks
EUR/USD stays below 1.0700 after US data

EUR/USD stays in a consolidation phase below 1.0700 in the early American session on Wednesday. The data from the US showed a strong increase in Durable Goods Orders, supporting the USD and making it difficult for the pair to gain traction.
USD/JPY refreshes 34-year high, attacks 155.00 as intervention risks loom

USD/JPY is renewing a multi-decade high, closing in on 155.00. Traders turn cautious on heightened risks of Japan's FX intervention. Broad US Dollar rebound aids the upside in the major. US Durable Goods data are next on tap.
Gold trades on the back foot, manages to hold above $2,300

Gold struggles to stage a rebound midweek following Monday's sharp decline but manages to hold above $2,300. The benchmark 10-year US Treasury bond yield stays in the green above 4.6% after US data, not allowing the pair to reverse its direction.
Worldcoin looks set for comeback despite Nvidia’s 22% crash Premium

Worldcoin price is in a better position than last week's and shows signs of a potential comeback. This development occurs amid the sharp decline in the valuation of the popular GPU manufacturer Nvidia.
Three fundamentals for the week: US GDP, BoJ and the Fed's favorite inflation gauge stand out Premium

While it is hard to predict when geopolitical news erupts, the level of tension is lower – allowing for key data to have its say. This week's US figures are set to shape the Federal Reserve's decision next week – and the Bank of Japan may struggle to halt the Yen's deterioration.

