![]()
European stocks are trading lower on this first day of the week, with some of the major indices such as the German DAX already below their lows from last week which in itself was a bad week for equities. Sentiment is downbeat for a variety of reasons, not least due to the growing unrest in Hong Kong and the on-going bombardments of IS targets in the Middle East. On top of this, the US Federal Reserve’s QE stimulus programme is coming to an end next month; this would thus remove, what many had considered, one of the major sources of support for stocks in recent years. What’s more, there is some uncertainty about the potential impact of this week’s key data releases (such as the Eurozone CPI and U.S. jobs report) on stocks. Meanwhile on a micro level, we’ve also has some sentiment-sapping news from individual companies. In Germany for example, shares in Commerzbank are sharply lower, which is weighing heavily on the DAX, after a Wall Street Journal report said the Manhattan US attorney was investigating the bank for allegations of money laundering.
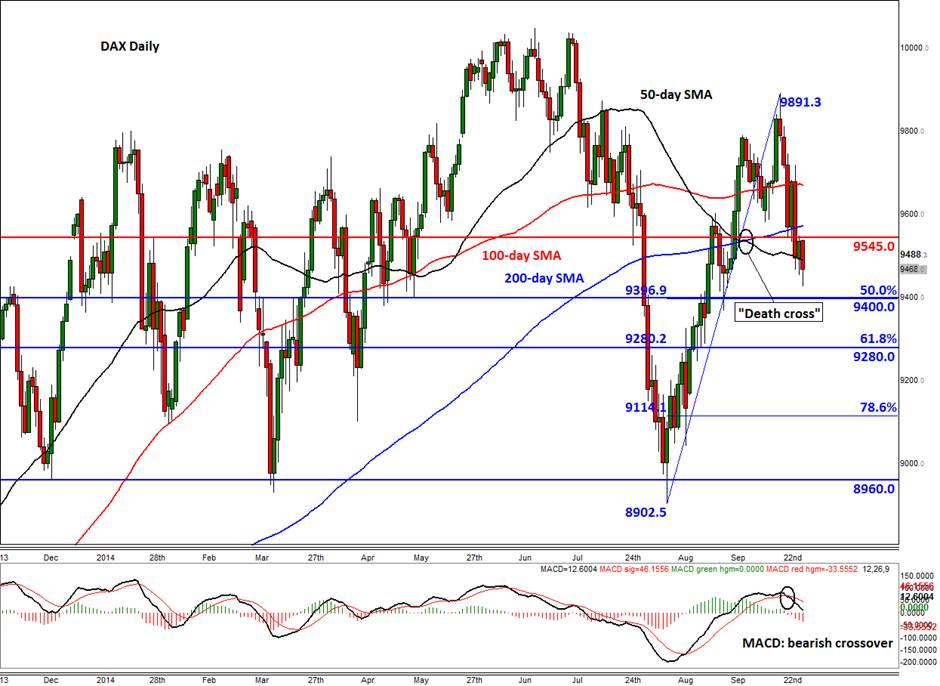
More worryingly, the long-term charts of the DAX are increasingly looking bearish and there is a possibility that the market may have already topped. Looking at the daily chart (figure 1) first, we can see that the index has taken out the 200-day moving average support (9570/5) and significantly is holding below it. On Friday, the index paused for breath around the 50-day SMA (9485/90) on short-side profit taking but today it has already broken below that level too. Meanwhile the 50-day SMA recently crossed below the 200 to create a so called “death crossover,” which is a further bearish development as some hedge funds and other trend-following speculators don’t normally buy when as asset’s moving averages are in this particular order . Indeed the MACD has already created a bearish crossover, which suggests that the momentum is with the sellers. So, if the index does what these technical developments suggest and head further lower then the next potential support levels to watch are at 9400, followed by 9280 and finally 8900/8960. The first two of these bearish targets also correspond with the 50 and 61.8 per cent retracement levels of the last upswing.
Meanwhile it would be a bullish development, in the short-term anyway, if the index breaks above Friday’s high (around 9545) and preferably closes above the 200-day SMA (9570/5) too. If so, we could see a potential move higher towards the 100-day SMA (9670) and then possibly resistance at 9800.
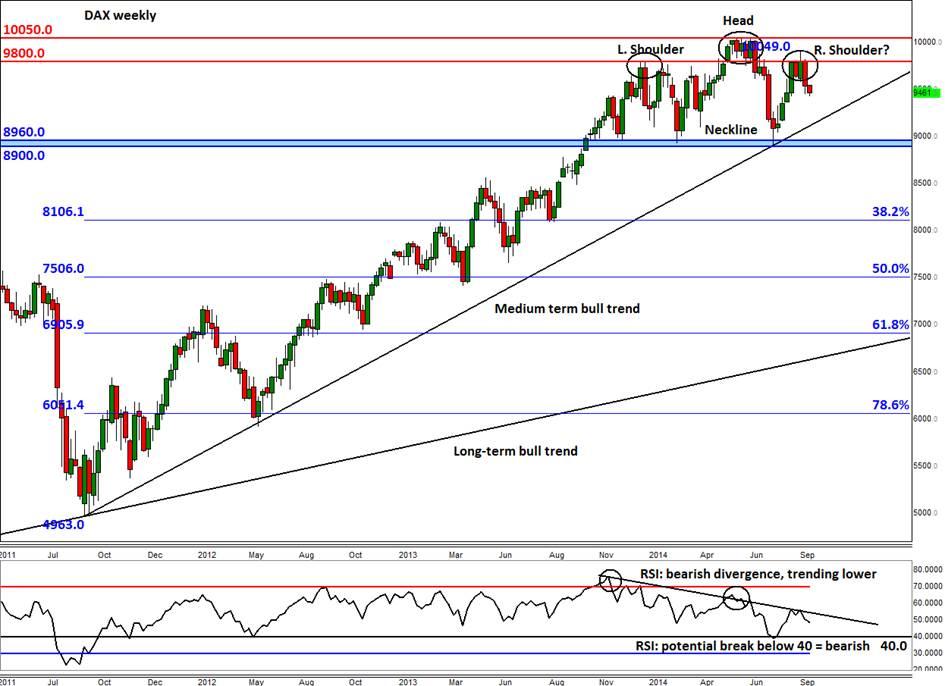
But the weekly chart (figure 2) looks even more bearish. As can be seen, there is a potential Head and Shoulders (H&S) reversal pattern, admittedly in its developing phase. The ‘left shoulder’ was formed around 9800 at the start of the year when a few months of weak price action started before the index finally managed to find good support around 8900/60 area in March. That led to an eventual rally towards, and momentarily beyond, the psychological 10000 barrier in the summer. But as the index failed to hold there, which led to a break back below 9800, the ‘head’ of the H&S pattern was formed. The DAX went on to fall all the way back to that 8900/60 area where it once again found strong support in August. This 8900/60 is a pivotal area and thus marks the ‘neckline’ of the H&S pattern. Meanwhile the ‘right shoulder’ of the H&S pattern has potentially been formed around 9800 in recent weeks. I say ‘potential’ because, as mentioned, this reversal pattern is still in its infancy. For all we know, the market could just as easily rally and break above 9800 and thus invalidate this bearish pattern.
For this H&S pattern to come to fruition, the index will first need to break several support levels that were identified on the daily time frame, above. On the weekly, we can see that there is a medium term bullish trend line that has been in place since September 2011 coming in – depending on how fast it will drop, if indeed it does – somewhere above 9100. Once this is taken out then there is the actual neckline of the pattern; as mentioned, this comes in at 8900/8960. If the index were to break below that area then the long-term 38.2% Fibonacci level at just above 6100 could be the next major downside target. The bearish view is bolstered by the weekly RSI which has diverged negatively and has been trending lower. If the RSI breaks below 40, this would confirm we are in a downward trend.
In summary, the price action and some of the other longer-term secondary technical indicators look weak for the DAX which suggest we could see further falls over the coming weeks and months. Thus it is in the bears’ interest to watch the short-term charts for a potential reversal in the trend. So far however we haven’t seen any significant bullish developments on any time frame, so the path of least resistance continues to remain to the downside.
Trading leveraged products such as FX, CFDs and Spread Bets carry a high level of risk which means you could lose your capital and is therefore not suitable for all investors. All of this website’s contents and information provided by Fawad Razaqzada elsewhere, such as on telegram and other social channels, including news, opinions, market analyses, trade ideas, trade signals or other information are solely provided as general market commentary and do not constitute a recommendation or investment advice. Please ensure you fully understand the risks involved by reading our disclaimer, terms and policies.
Recommended Content
Editors’ Picks
AUD/USD remained bid above 0.6500

AUD/USD extended further its bullish performance, advancing for the fourth session in a row on Thursday, although a sustainable breakout of the key 200-day SMA at 0.6526 still remain elusive.
EUR/USD faces a minor resistance near at 1.0750

EUR/USD quickly left behind Wednesday’s small downtick and resumed its uptrend north of 1.0700 the figure, always on the back of the persistent sell-off in the US Dollar ahead of key PCE data on Friday.
Gold holds around $2,330 after dismal US data

Gold fell below $2,320 in the early American session as US yields shot higher after the data showed a significant increase in the US GDP price deflator in Q1. With safe-haven flows dominating the markets, however, XAU/USD reversed its direction and rose above $2,340.
Bitcoin price continues to get rejected from $65K resistance as SEC delays decision on spot BTC ETF options

Bitcoin (BTC) price has markets in disarray, provoking a broader market crash as it slumped to the $62,000 range on Thursday. Meanwhile, reverberations from spot BTC exchange-traded funds (ETFs) continue to influence the market.
US economy: slower growth with stronger inflation

The dollar strengthened, and stocks fell after statistical data from the US. The focus was on the preliminary estimate of GDP for the first quarter. Annualised quarterly growth came in at just 1.6%, down from the 2.5% and 3.4% previously forecast.

