![]()
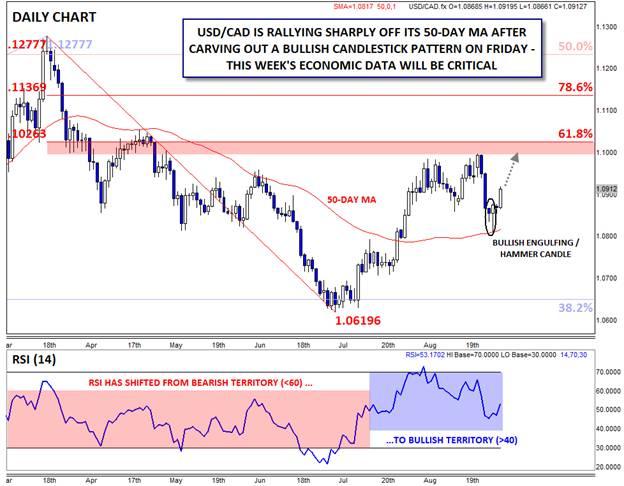
We’ve been keeping a close eye on USDCAD as a barometer of broader USD strength over the last few weeks. Last week, the Loonie took the upper hand against the greenback, with the USDCAD breaking below its ascending triangle pattern and trading all the way down to the 50-day MA near 1.0810 (see “USDCAD Breaks Below Bullish Trend Line – Now Eyeing August Lows at 1.0860†for more). While most of last week’s price action was to the downside, a big development Friday suggested that the pair may have carved out a near-term bottom and could rally as we move into September.
On Friday morning, USDCAD kissed support at its 50-day MA before rallying into the weekend. This price action created a large Bullish Pin Candle*/Bullish Engulfing Candle** on the daily chart, showing a sharp shift from selling to buying pressure. Often, these candlestick patterns mark a near-term bottom in a market, and rates are not surprisingly extending the rally to regain the 1.0900 handle ahead of today’s US open. Meanwhile, the pair’s RSI has turned higher from the mid-40s, keeping the widely-followed indicator in bullish territory (>40).
From here, bulls may try to drive the pair up to strong previous/Fibonacci resistance in zone around 1.1000; if that threshold is eclipsed, a continuation to above 1.1100 becomes likely. Readers should also note that this week’s data calendar is jam-packed with high-impact economic reports culminating with the dual monthly jobs reports on Friday (see below), and the outcome of these fundamental developments could have a larger-than-usual impact on how the USDCAD moves this week.
Key Economic Data that May Impact USDCAD This Week (all times GMT):
Today: US ISM Manufacturing PMI (14:00)
Wednesday: BOC Interest Rate Decision and Statement (14:00), US Factory Orders (14:00), US Beige Book (18:00)
Thursday: ADP Non-Farm Employment (12:15), Canadian Trade Balance data (12:30), US Initial Unemployment Claims and Trade Balance (12:30), ISM Non-Manufacturing PMI (14:00)
Friday: US Non-Farm Payroll Report (12:30), CA Employment Report (12:30), CA Ivey PMI (14:00)
*A Bullish Pin (Pinnochio) candle, also known as a hammer or paper umbrella, is formed when prices fall within the candle before buyers step in and push prices back up to close near the open. It suggests the potential for a bullish continuation if the high of the candle is broken.
**A Bullish Engulfing candle is formed when the candle breaks below the low of the previous period before buyers step in and push rates up to close above the high of the previous candle. It indicates that the buyers have wrested control of the market from the sellers.
This research is for informational purposes and should not be construed as personal advice. Trading any financial market involves risk. Trading on leverage involves risk of losses greater than deposits.
Recommended Content
Editors’ Picks
AUD/USD failed just ahead of the 200-day SMA

Finally, AUD/USD managed to break above the 0.6500 barrier on Wednesday, extending the weekly recovery, although its advance faltered just ahead of the 0.6530 region, where the key 200-day SMA sits.
EUR/USD met some decent resistance above 1.0700

EUR/USD remained unable to gather extra upside traction and surpass the 1.0700 hurdle in a convincing fashion on Wednesday, instead giving away part of the weekly gains against the backdrop of a decent bounce in the Dollar.
Gold keeps consolidating ahead of US first-tier figures

Gold finds it difficult to stage a rebound midweek following Monday's sharp decline but manages to hold above $2,300. The benchmark 10-year US Treasury bond yield stays in the green above 4.6% after US data, not allowing the pair to turn north.
Bitcoin price could be primed for correction as bearish activity grows near $66K area

Bitcoin (BTC) price managed to maintain a northbound trajectory after the April 20 halving, despite bold assertions by analysts that the event would be a “sell the news” situation. However, after four days of strength, the tables could be turning as a dark cloud now hovers above BTC price.
Bank of Japan's predicament: The BOJ is trapped

In this special edition of TradeGATEHub Live Trading, we're joined by guest speaker Tavi @TaviCosta, who shares his insights on the Bank of Japan's current predicament, stating, 'The BOJ is Trapped.'
