![]()
One of the most reliable cause-and-effect relationships in all of global markets is that violence in the Middle East tends to lead to a spike in oil prices. As you might expect, the most direct explanation for this phenomenon comes from concerns about supply disruption in nearby oil-producing regions like Saudi Arabia, Iran, Russia, and the UAE. In addition, risk-averse firms also rush to hedge, or lock in, the current oil price fearing that it could rise further, and these actions can themselves push oil prices higher, becoming a bit of a self-fulfilling prophecy.
With all that said, Oil’s recent failure to rally is particularly significant. Despite escalating violence between Israel and Gaza, not to mention the ongoing situation between Russia and Ukraine, WTI prices have actually fallen sharply over the past month. From an intermarket perspective, the rally in the US dollar has certainly played a role in keeping oil down, but the lack of a meaningful rally in oil
Technical View: WTI
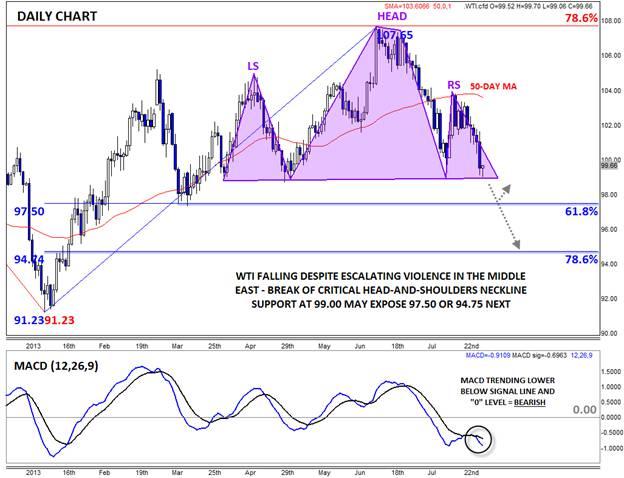
Looking to the chart, WTI stalled out perfectly against the 78.6% Fibonacci retracement of its Sept.-Oct. drop at 107.70 last month, and rates have since fallen a full eight points to trade under the key $100 level. More broadly, the price action over the last four months has created a potential Head-and-Shoulders pattern; for traders who are not familiar, this classic technical pattern shows a shift from an uptrend (higher highs and higher lows) to a downtrend (lower highs and lower lows) and would be confirmed by a break below the neckline at 99.00.
While that support area is holding firm thus far today, the MACD indicator suggests that it could be in jeopardy. The indicator recently rolled over and is currently trending downward below both its signal line and “0†level. This development shows a shift to bearish momentum that could put a lid on any short-term bounces from 99.00 support. At the same time, the 50-day MA is also turning lower, suggesting that the medium-term trend is shifting to the downside.
For now, the Head-and-Shoulders is simply a pattern to monitor as long as rates hold above 99.00. However, with the always high-impact NFP report less than 24 hours away (stay tuned for our full NFP preview report later today), WTI could break this floor ahead of the weekend. If the pattern is confirmed by a break and close below 99.00, the next levels of support to watch will be 97.50 (61.8% Fibonacci support), .9600 (200-week MA, not shown), and 94.75 (78.6% Fib support). Meanwhile, the structure of the H&S pattern will remain intact as long as the pair says below the 50-day MA near 103.00.
This research is for informational purposes and should not be construed as personal advice. Trading any financial market involves risk. Trading on leverage involves risk of losses greater than deposits.
Recommended Content
Editors’ Picks
EUR/USD clings to daily gains above 1.0650

EUR/USD gained traction and turned positive on the day above 1.0650. The improvement seen in risk mood following the earlier flight to safety weighs on the US Dollar ahead of the weekend and helps the pair push higher.
GBP/USD recovers toward 1.2450 after UK Retail Sales data

GBP/USD reversed its direction and advanced to the 1.2450 area after touching a fresh multi-month low below 1.2400 in the Asian session. The positive shift seen in risk mood on easing fears over a deepening Iran-Israel conflict supports the pair.
Gold holds steady at around $2,380 following earlier spike

Gold stabilized near $2,380 after spiking above $2,400 with the immediate reaction to reports of Israel striking Iran. Meanwhile, the pullback seen in the US Treasury bond yields helps XAU/USD hold its ground.
Bitcoin Weekly Forecast: BTC post-halving rally could be partially priced in Premium

Bitcoin price shows no signs of directional bias while it holds above $60,000. The fourth BTC halving is partially priced in, according to Deutsche Bank’s research.
Week ahead – US GDP and BoJ decision on top of next week’s agenda

US GDP, core PCE and PMIs the next tests for the Dollar. Investors await BoJ for guidance about next rate hike. EU and UK PMIs, as well as Australian CPIs also on tap.
