![]()
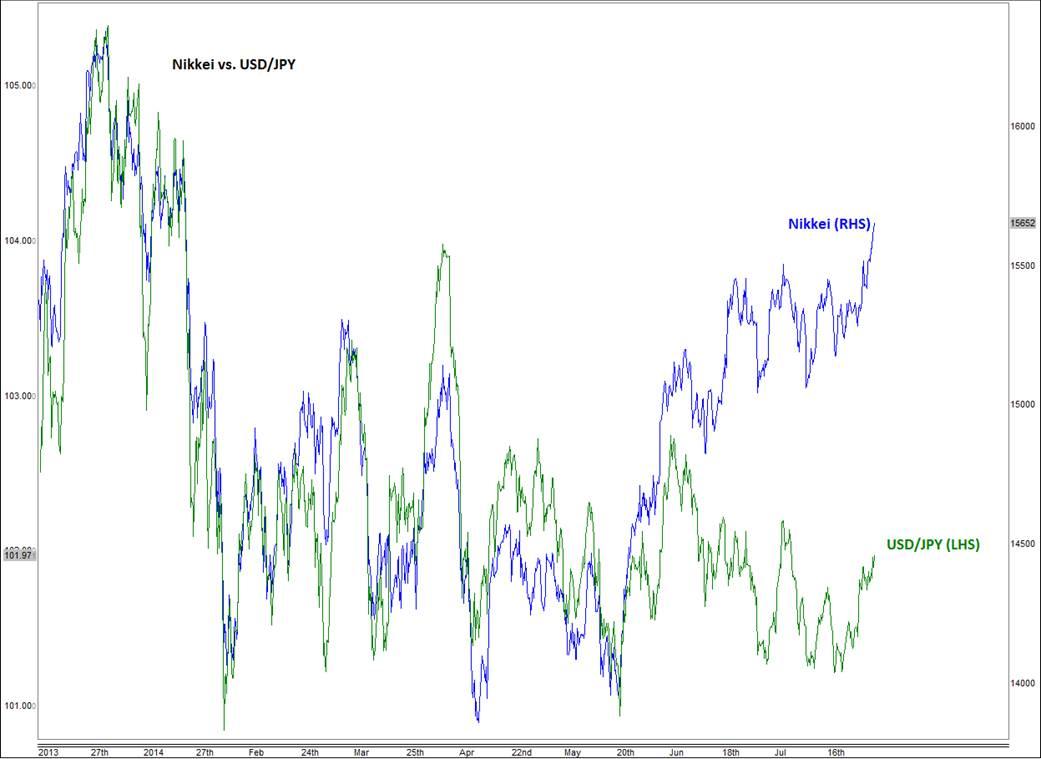
Assuming the two assets will once again rebuild their strong positive relationship soon, we may either see a sharp correction in the Nikkei and continued inactivity in USD/JPY, or a vicious move higher in USD/JPY accompanied with a less robust rally in the Nikkei. With so much economic data due to be released this week (read our weekly outlook guide here) there’s potential for a strong move in at least one of these assets. Let’s look at the two in more detail:
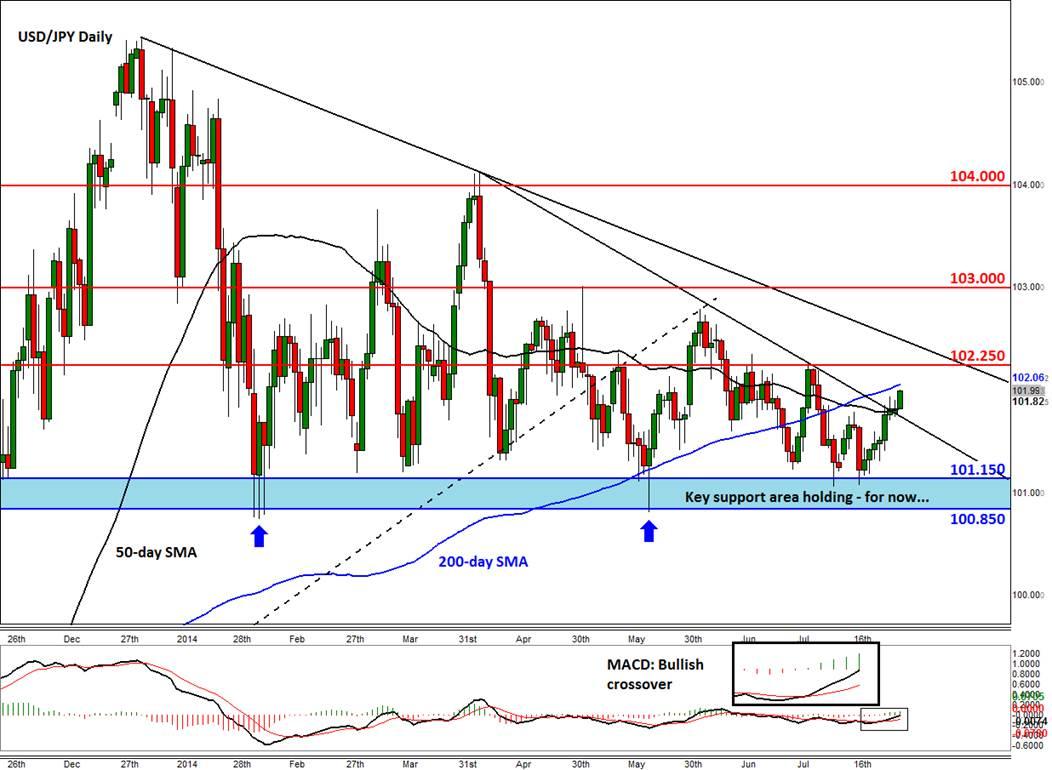
As my colleague Matt Weller highlighted last week, the USD/JPY had been stuck inside a descending triangle pattern. As can be seen from the daily chart, it looks like the bulls have won this battle for the bears were unable to hold price below the critical support range of 100.85/101.15. What’s more, the currency pair has broken above a corrective trend line and this breakout has been confirmed by MACD posting a bullish crossover. Going forward the key resistance levels to watch are 102.25, 103.00 and 104.00. A slightly longer-term bearish trend line comes in somewhere between 102.25 and 102.50. Support is seen around 101.80, which also corresponds with the 50-day SMA, followed by 101.15 and 100.85.
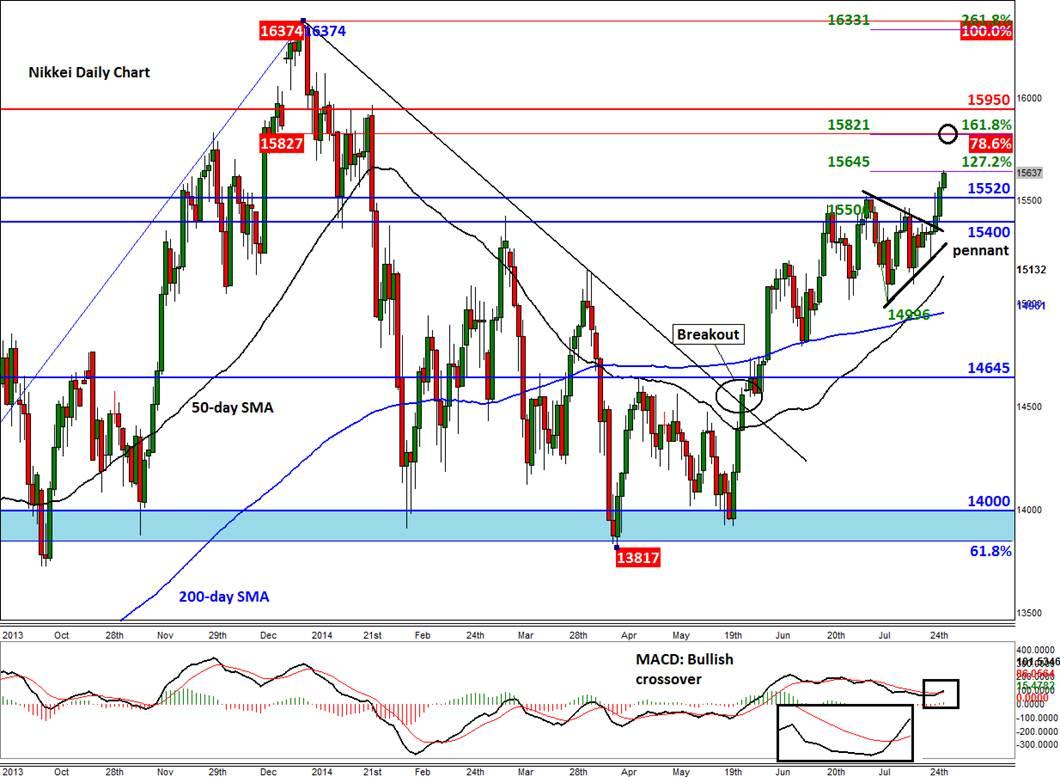
The Nikkei meanwhile has also created a bullish crossover after the index broke out a pennant consolidation pattern to the upside. It has since taken out several resistance levels including the 15500/20 area, which is now likely to turn into support. The next levels to watch on the upside are 15820, 15950 and 16370/5. The first of these three potential resistance areas is the convergence of two Fibonacci levels: the 78.6% retracement of the down move from the January peak with the 161.8% extension of a much-smaller corrective intra-month move. The 15950 mark was previously resistance while 16370/5 was the high achieved in January. Overall, the technical picture for the Nikkei is still looking very strong and as things stand I wouldn’t be surprised if the index not only reaches those targets but breaks above them too.
Trading leveraged products such as FX, CFDs and Spread Bets carry a high level of risk which means you could lose your capital and is therefore not suitable for all investors. All of this website’s contents and information provided by Fawad Razaqzada elsewhere, such as on telegram and other social channels, including news, opinions, market analyses, trade ideas, trade signals or other information are solely provided as general market commentary and do not constitute a recommendation or investment advice. Please ensure you fully understand the risks involved by reading our disclaimer, terms and policies.
Recommended Content
Editors’ Picks
EUR/USD clings to daily gains above 1.0650

EUR/USD gained traction and turned positive on the day above 1.0650. The improvement seen in risk mood following the earlier flight to safety weighs on the US Dollar ahead of the weekend and helps the pair push higher.
GBP/USD recovers toward 1.2450 after UK Retail Sales data

GBP/USD reversed its direction and advanced to the 1.2450 area after touching a fresh multi-month low below 1.2400 in the Asian session. The positive shift seen in risk mood on easing fears over a deepening Iran-Israel conflict supports the pair.
Gold holds steady at around $2,380 following earlier spike

Gold stabilized near $2,380 after spiking above $2,400 with the immediate reaction to reports of Israel striking Iran. Meanwhile, the pullback seen in the US Treasury bond yields helps XAU/USD hold its ground.
Bitcoin Weekly Forecast: BTC post-halving rally could be partially priced in Premium

Bitcoin price shows no signs of directional bias while it holds above $60,000. The fourth BTC halving is partially priced in, according to Deutsche Bank’s research.
Week ahead – US GDP and BoJ decision on top of next week’s agenda

US GDP, core PCE and PMIs the next tests for the Dollar. Investors await BoJ for guidance about next rate hike. EU and UK PMIs, as well as Australian CPIs also on tap.


