![]()
In the days before ubiquitous computers, floor traders needed a simple way to calculate intraday levels of support and resistance. Enter pivot points. Pivot points use the high, low, and closing price of the previous day to project support and resistance levels for the current day. For instance, the central pivot point is calculated as the (high + low + close) / 3, or effectively the average price of the previous day. As a general rule of thumb, if price opens above this central pivot point (often called the “fulcrum” of the day’s trade), it is more likely to trend higher and vice-versa. Daily pivot points are still one of the most widely-used technical indicators, but like all technical tools, pivot points are even more reliable on longer-term timeframes. Though they don’t come into play often, yearly pivot points are among the most effective tools in a technical trader’s arsenal.
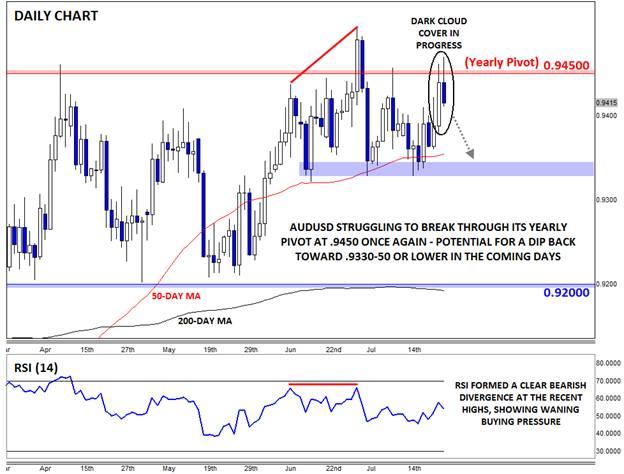
Looking to the AUDUSD, the yearly pivot comes in at .9450, the exact area that has been putting a ceiling on the pair for more than three months now. A few weeks ago, the AUDUSD tried to break above its yearly fulcrum, but veiled threats of intervention by RBA Governor Stevens pushed the pair back down, much as we saw from the RBNZ last night. After another run toward .9450 yesterday, rates are once again being rejected, despite ostensibly bullish news out of China, Australia’s biggest trade partner.
Beyond the monthly pivot point, there are some other technical signs that the AUDUSD may dip from here. For one, the pair is currently showing a Dark Cloud Cover* candlestick formation, showing a shift from buying to selling pressure and increasing the likelihood of a near-term top. Meanwhile, the RSI indicator formed a clear bearish divergence at the recent highs, suggesting that the bullish momentum is ebbing.
Of course, the Aussie may be able to muster enough strength to break sustainably above the .9450 level next week, but until it does, a bearish bias is appropriate in the short term. The most immediate level of support is at convergence of the 50-day MA and previous lows in the .9330-50 zone, but if that floor is broken, a continuation down toward the 200-day MA around .9200 may be seen.
Source: FOREX.com
General Risk Warning for stocks, cryptocurrencies, ETP, FX & CFD Trading. Investment assets are leveraged products. Trading related to foreign exchange, commodities, financial indices, stocks, ETP, cryptocurrencies, and other underlying variables carry a high level of risk and can result in the loss of all of your investment. As such, variable investments may not be appropriate for all investors. You should not invest money that you cannot afford to lose. Before deciding to trade, you should become aware of all the risks associated with trading, and seek advice from an independent and suitably licensed financial advisor. Under no circumstances shall Witbrew LLC and associates have any liability to any person or entity for (a) any loss or damage in whole or part caused by, resulting from, or relating to any transactions related to investment trading or (b) any direct, indirect, special, consequential or incidental damages whatsoever.
Recommended Content
Editors’ Picks
EUR/USD hovers around 1.0700 ahead of German IFO survey

EUR/USD is consolidating recovery gains at around 1.0700 in the European morning on Wednesday. The pair stays afloat amid strong Eurozone business activity data against cooling US manufacturing and services sectors. Germany's IFO survey is next in focus.
USD/JPY refreshes 34-year high, attacks 155.00 as intervention risks loom

USD/JPY is renewing a multi-decade high, closing in on 155.00. Traders turn cautious on heightened risks of Japan's FX intervention. Broad US Dollar rebound aids the upside in the major. US Durable Goods data are next on tap.
Gold price flat lines above $2,300 mark, looks to US macro data for fresh impetus

Gold price (XAU/USD) struggles to capitalize on the previous day's bounce from over a two-week low – levels just below the $2,300 mark – and oscillates in a narrow range heading into the European session on Wednesday.
Worldcoin looks set for comeback despite Nvidia’s 22% crash Premium

Worldcoin (WLD) price is in a better position than last week's and shows signs of a potential comeback. This development occurs amid the sharp decline in the valuation of the popular GPU manufacturer Nvidia.
Three fundamentals for the week: US GDP, BoJ and the Fed's favorite inflation gauge stand out Premium

While it is hard to predict when geopolitical news erupts, the level of tension is lower – allowing for key data to have its say. This week's US figures are set to shape the Federal Reserve's decision next week – and the Bank of Japan may struggle to halt the Yen's deterioration.
