![]()
Tackling the fundamental side first, the Bank of Canada’s statement yesterday was decidedly neutral. The central bank chose to omit its previously-standard line about the risks of low inflation, but expressed “serial disappointment†with the global economy as a whole. Accordingly, the BOC raised its inflation forecasts for 2014, but cut its growth forecasts for both 2014 and 2015, painting a thoroughly messy picture for USDCAD traders.
The more important fundamental development this week has been the path of oil prices. As my colleague Fawad Razaqzada noted earlier today, oil prices have come storming back over the last two days, with WTI rising from $99 all the way to $103 as of writing. For the uninitiated, Canada is the world’s sixth largest oil producer and the largest single exporter of oil to the United States, so the loonie tends to be correlated with “black gold.†With oil prices bouncing back toward the top of their recent range, the USDCAD bounce is facing a stiff fundamental headwind.
Technical View: USDCAD
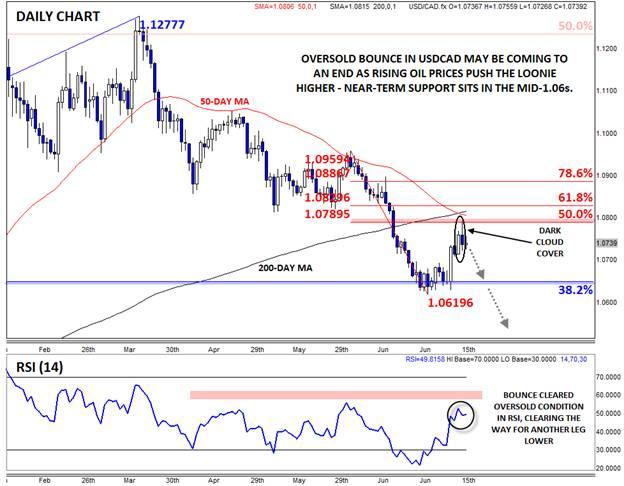
The daily chart puts the recent bounce in context. As we started this month, rates were deeply oversold, with the daily RSI dipping down toward 20; the pair was also testing key support at the 38.2% Fibonacci retracement of the Sept. 2012 – March 2014 rally at 1.0645, so a bounce was highly likely.
Looking objectively at today’s situation reveals a completely different technical picture. The pair has now already reached the measured move target of its 4hr inverted Head-and-Shoulders pattern at 1.0770 (see below for more) and rates just put in a Dark Cloud Cover* candlestick formation off the 50% Fibonacci retracement near 1.0790. This candlestick formation shows a shift from buying to selling pressure and is often seen at near-term tops in the market. In addition, the USDCAD saw a “death cross†of the 50- and 200-day MAs earlier this week, suggesting that the longer-term trend is turning to the downside.
With technical signs starting to turn in favor of the bears, the USDCAD may return back to last week’s levels in the mid-1.0600s over the next few days. Beyond that, a confirmed break below 1.0600 could open the door for even more weakness toward 1.0500 or below as we move through the latter half of the summer. Meanwhile, only a sustained recovery back above the moving averages near 1.0800 would shift the medium-term bias back to the topside from here.
This research is for informational purposes and should not be construed as personal advice. Trading any financial market involves risk. Trading on leverage involves risk of losses greater than deposits.
Recommended Content
Editors’ Picks
EUR/USD clings to daily gains above 1.0650

EUR/USD gained traction and turned positive on the day above 1.0650. The improvement seen in risk mood following the earlier flight to safety weighs on the US Dollar ahead of the weekend and helps the pair push higher.
GBP/USD recovers toward 1.2450 after UK Retail Sales data

GBP/USD reversed its direction and advanced to the 1.2450 area after touching a fresh multi-month low below 1.2400 in the Asian session. The positive shift seen in risk mood on easing fears over a deepening Iran-Israel conflict supports the pair.
Gold holds steady at around $2,380 following earlier spike

Gold stabilized near $2,380 after spiking above $2,400 with the immediate reaction to reports of Israel striking Iran. Meanwhile, the pullback seen in the US Treasury bond yields helps XAU/USD hold its ground.
Bitcoin Weekly Forecast: BTC post-halving rally could be partially priced in Premium

Bitcoin price shows no signs of directional bias while it holds above $60,000. The fourth BTC halving is partially priced in, according to Deutsche Bank’s research.
Week ahead – US GDP and BoJ decision on top of next week’s agenda

US GDP, core PCE and PMIs the next tests for the Dollar. Investors await BoJ for guidance about next rate hike. EU and UK PMIs, as well as Australian CPIs also on tap.
