![]()
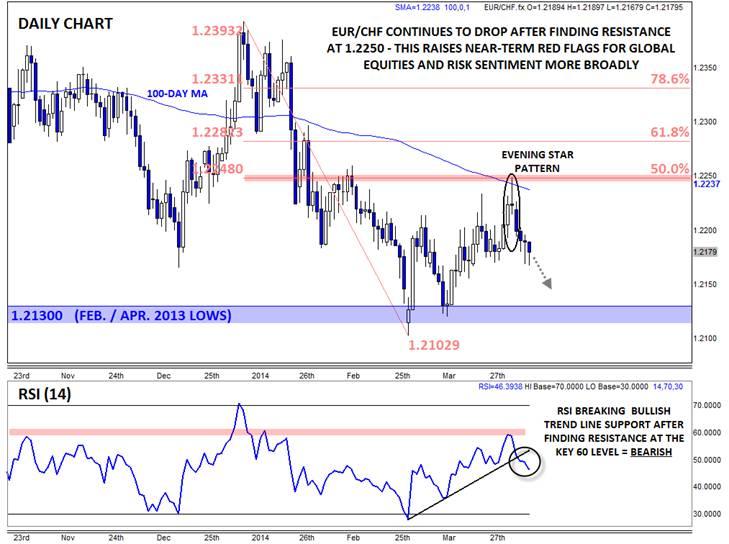
Volatility in the EUR/CHF has been subdued for years now, ever since the Swiss National Bank set an explicit floor at 1.20 in the pair. Despite the low volatility, the pair can still provide a useful barometer of risk sentiment in the market. Because the Swiss franc is still seen as a safe haven currency, the EUR/CHF tends to fall when traders are pessimistic about the global economy and rise when traders are feeling more optimistic. In fact, the price action over the last couple of days provides a clear example of that phenomenon: when traders were upbeat as yields and stocks started to break out midway last week, the EUR/CHF rose to a 2-month high at 1.2250. However, as equities and yields reversed back to the downside late last week and early this week, the EUR/CHF fell in turn.
At this point, the EUR/CHF is raising some near-term red flags on the outlook for global risk appetite. On a technical basis, the pair carved out a clear Evening Star* candlestick formation off resistance at the converging 100-day MA and 50% Fib retracement near 1.2250. This relatively rare 3-candle reversal pattern shows a gradual shift from buying to selling pressure and typically marks a top in the market. Confirming this signal, the pair’s RSI indicator just broke below its own rising trend line after finding resistance near the key 60 level. This price action suggests that the sellers still have the upper hand and portends a potential continuation lower over the coming days.
To the downside, bearish traders may look to target the lower 1.2100s, an area that marks the lows from early 2013, as long as the pair stays below its 100-day MA. More broadly, global equity and bond traders may want to exercise some caution unless EUR/CHF can regain its bullish mojo. Regardless, traders of all stripes should consider reserving some “chart space” on their trading computers for keeping an eye on EUR/CHF as a gauge of overall risk sentiment.
An Evening Star candle formation is relatively rare candlestick formation created by a long green candle, followed a small-bodied candle near the top of the first candle, and completed by a long-bodied red candle. It represents a transition from bullish to bearish momentum and foreshadows more weakness to come.
This research is for informational purposes and should not be construed as personal advice. Trading any financial market involves risk. Trading on leverage involves risk of losses greater than deposits.
Recommended Content
Editors’ Picks
AUD/USD hovers around 0.6500 amid light trading, ahead of US GDP

AUD/USD is trading close to 0.6500 in Asian trading on Thursday, lacking a clear directional impetus amid an Anzac Day holiday in Australia. Meanwhile, traders stay cautious due ti risk-aversion and ahead of the key US Q1 GDP release.
USD/JPY finds its highest bids since 1990, near 155.50

USD/JPY keeps breaking into its highest chart territory since June of 1990 early Thursday, testing 155.50 for the first time in 34 years as the Japanese Yen remains vulnerable, despite looming Japanese intervention risks. Focus shifts to Thursday's US GDP report and the BoJ decision on Friday.
Gold price lacks firm intraday direction, holds steady above $2,300 ahead of US data

Gold price remains confined in a narrow band for the second straight day on Thursday. Reduced Fed rate cut bets and a positive risk tone cap the upside for the commodity. Traders now await key US macro data before positioning for the near-term trajectory.
Injective price weakness persists despite over 5.9 million INJ tokens burned

Injective price is trading with a bearish bias, stuck in the lower section of the market range. The bearish outlook abounds despite the network's deflationary efforts to pump the price. Coupled with broader market gloom, INJ token’s doomed days may not be over yet.
Meta Platforms Earnings: META sinks 10% on lower Q2 revenue guidance Premium

This must be "opposites" week. While Doppelganger Tesla rode horrible misses on Tuesday to a double-digit rally, Meta Platforms produced impressive beats above Wall Street consensus after the close on Wednesday, only to watch the share price collapse by nearly 10%.
