![]()
With just a week to go until the next OPEC meeting, crude oil prices are showing signs of steadiness. The market is seemingly throwing the ball in the cartel’s court and is demanding the production quota to be trimmed meaningfully. This implies that in the event the OPEC fails to agree on cutting its output, prices are likely to extend their falls. For now though, oil traders appear to be happy with the extent of the recent drop – for if they weren’t, prices should have fallen more today on the back of those disappointing manufacturing PMI readings from China, Japan and the Eurozone. Granted, the US Philly Fed survey might have had its second best reading since records began, but this is unlikely to have negated the impact of the PMI falls in the aforementioned global regions which account for the vast majority of global oil consumption. It is also worth pointing out that WTI prices failed to move lower on the back of yesterday’s official US oil report, which showed a surprise increase in crude stocks; this could also be interpreted as a bullish sign. That said, crude imports were at least partially responsible for the build, for they were up a good 761 thousand barrels per day more compared with the previous week. In other words, it wasn’t just the excessive production in the US that contributed to the latest inventories build. What’s more, distillate stocks actually decreased sharper than expected, suggesting demand for heating is coming back due to the colder weather. Indeed, natural gas prices today hit their highest levels since June, supported by a sharp reduction in gas storage: according to the Energy Information Administration, they fell by a good 17 billion cubic feet in the week to Friday 14 November. Expectations were for a 12 Bcf reduction.
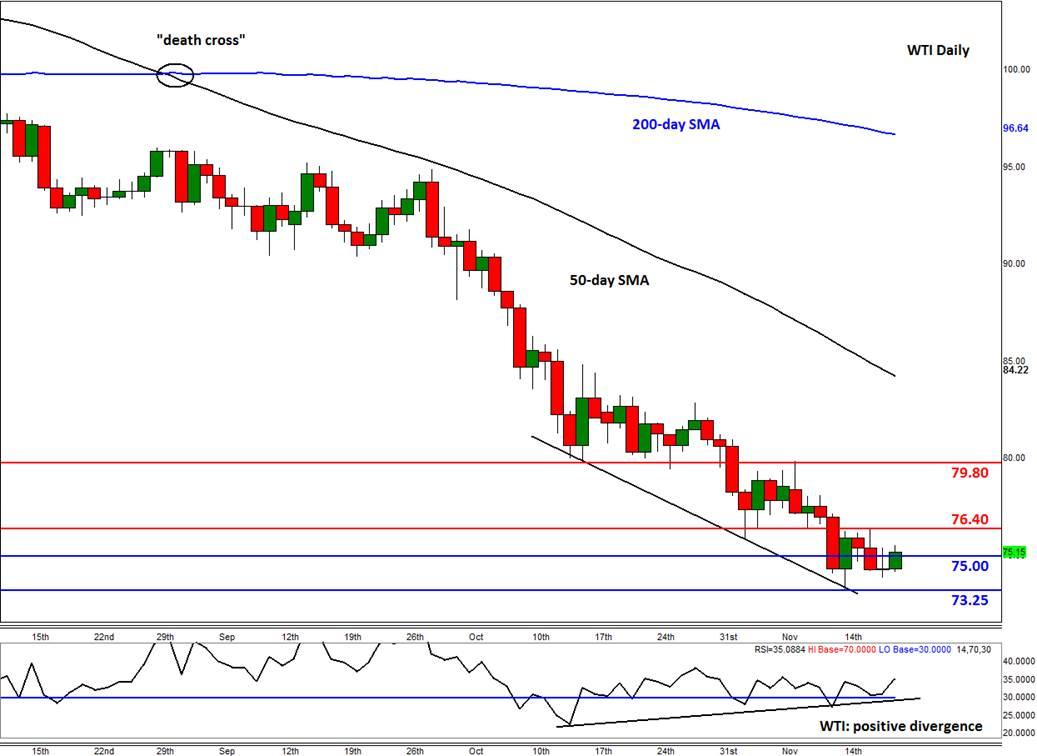
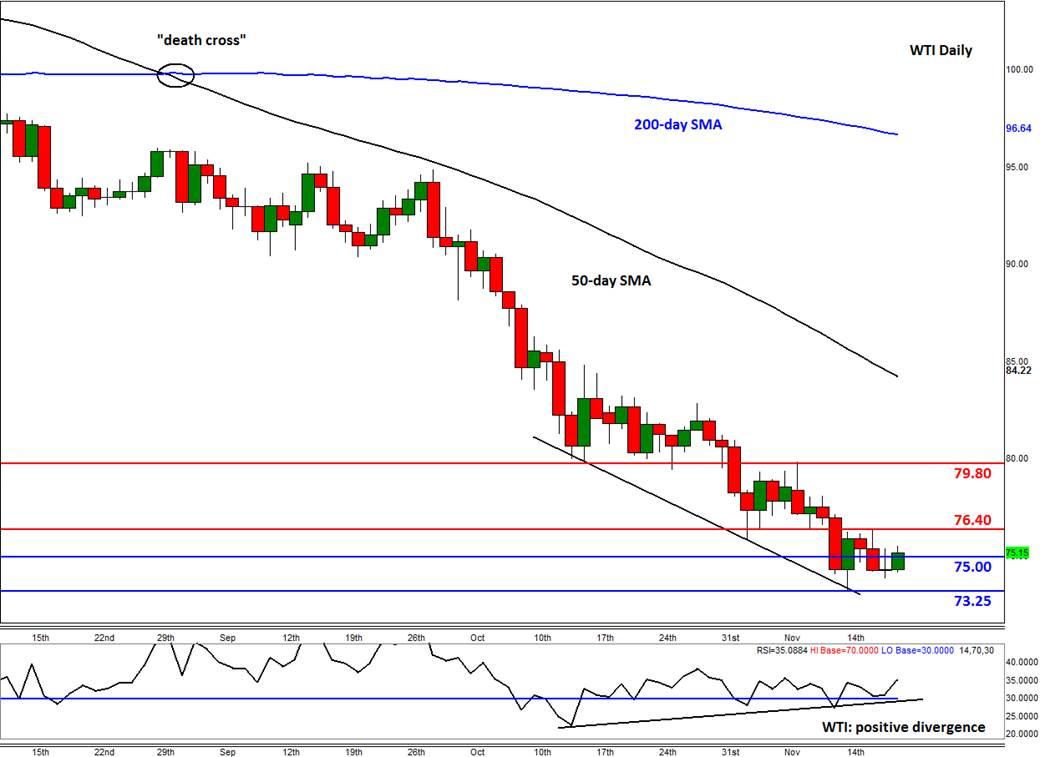
From a technical point of view, the selling momentum behind WTI appears to be fading around the psychological $75 mark. This is highlighted by the RSI forming a positive divergence recently (it has made a higher low even as WTI formed a lower low), which in itself is a potentially bullish development. From a price action point of view, WTI formed a doji candle on the daily chart yesterday which pointed to indecision. This incisiveness has discouraged the bears to establish fresh bold positions today, which is probably why prices didn’t extend their falls despite the weaker PMI numbers. But all in all, it is too early to say whether prices have found a bottom yet. The key resistance levels remain intact and while that is the case, the bulls should proceed with extra caution. The next resistances are around $76.40 and $79.80 – levels that were formerly support and have turned into resistance. Once one or two of such levels break, we could see some sellers rush for the exits and that could provide some support for prices. Having said all that, the vast majority of the market is still bearish on oil prices for good fundamental reasons (i.e. excessive supply and weaker demand growth) and so further losses should not come as surprise to anyone.
Figure 1:
Source: FOREX.com. Please note this product is not available to US clients.
Figure 2:
Source: FOREX.com. Please note this product is not available to US clients.
General Risk Warning for stocks, cryptocurrencies, ETP, FX & CFD Trading. Investment assets are leveraged products. Trading related to foreign exchange, commodities, financial indices, stocks, ETP, cryptocurrencies, and other underlying variables carry a high level of risk and can result in the loss of all of your investment. As such, variable investments may not be appropriate for all investors. You should not invest money that you cannot afford to lose. Before deciding to trade, you should become aware of all the risks associated with trading, and seek advice from an independent and suitably licensed financial advisor. Under no circumstances shall Witbrew LLC and associates have any liability to any person or entity for (a) any loss or damage in whole or part caused by, resulting from, or relating to any transactions related to investment trading or (b) any direct, indirect, special, consequential or incidental damages whatsoever.
Recommended Content
Editors’ Picks
EUR/USD clings to daily gains above 1.0650

EUR/USD gained traction and turned positive on the day above 1.0650. The improvement seen in risk mood following the earlier flight to safety weighs on the US Dollar ahead of the weekend and helps the pair push higher.
GBP/USD recovers toward 1.2450 after UK Retail Sales data

GBP/USD reversed its direction and advanced to the 1.2450 area after touching a fresh multi-month low below 1.2400 in the Asian session. The positive shift seen in risk mood on easing fears over a deepening Iran-Israel conflict supports the pair.
Gold holds steady at around $2,380 following earlier spike

Gold stabilized near $2,380 after spiking above $2,400 with the immediate reaction to reports of Israel striking Iran. Meanwhile, the pullback seen in the US Treasury bond yields helps XAU/USD hold its ground.
Bitcoin Weekly Forecast: BTC post-halving rally could be partially priced in Premium

Bitcoin price shows no signs of directional bias while it holds above $60,000. The fourth BTC halving is partially priced in, according to Deutsche Bank’s research.
Week ahead – US GDP and BoJ decision on top of next week’s agenda

US GDP, core PCE and PMIs the next tests for the Dollar. Investors await BoJ for guidance about next rate hike. EU and UK PMIs, as well as Australian CPIs also on tap.

