![]() Arkadiusz Sieroń
Arkadiusz Sieroń
Sunshine Profits
The gold to silver ratio is the most popular ratio among the precious metals. However, we can also link gold prices to platinum prices. Mathematically, the goldtoplatinum ratio is the price of gold divided by the price of platinum. It describes how many ounces of platinum are needed to purchase one ounce of gold, indicating the relative strength of gold prices compared to platinum prices. The indicator works just as the goldtosilver ratio, so we will not explain its mechanics, but move straight to analysis of the longterm trends in the ratio. Let's examine thoroughly the chart below, which presents the number of platinum ounces it took to buy a single ounce of gold since 1975 (we use futures prices, as data series of London fix for platinum is available only from 1990).
Chart 1: The gold to platinum ratio (the price of gold divided by the price of platinum, red line, right axis), the price of gold (yellow line, left axis, Comex Gold Futures, front month) and the price of platinum (blue line, left axis, Nymex platinum futures, front month) from 1975 to May 13, 2016.
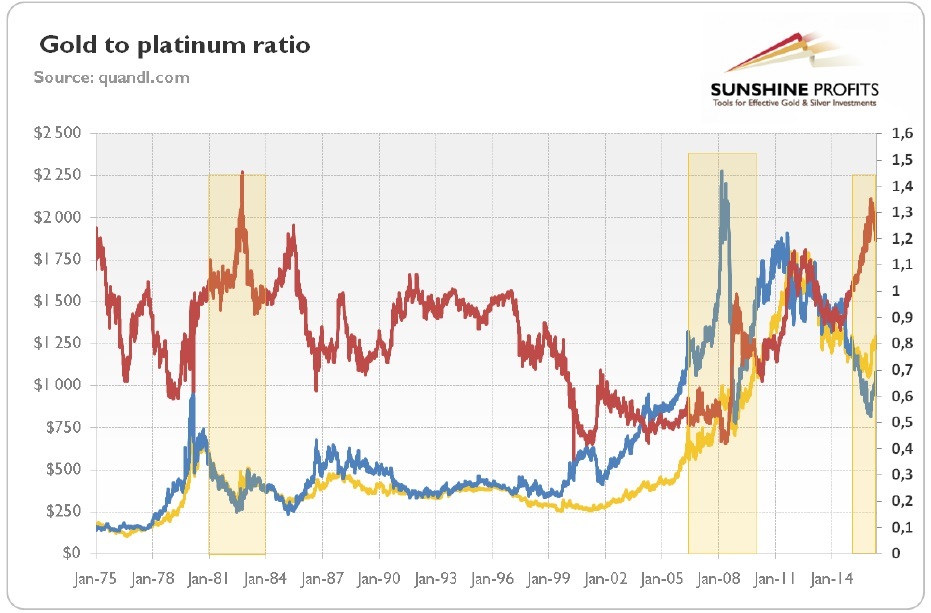
As one can see, the goldtoplatinum ratio was decreasing in the second half of the 1970s, reaching the bottom around 0.59 in February 1979. It implies that platinum was overvalued to gold, or gold was relatively cheap compared to platinum. The ratio was rising in the beginning of the 1980s, reaching its alltime peak around 1.44 in September 1982, indicating that gold was expensive in relation to platinum, or platinum was undervalued compared to gold. Then, the ratio was generally falling for the rest of the 1980s, as platinum prices were performing better than gold prices. During the 1990s, the goldtoplatinum ratio was slightly below unity for most of the time. In 1997, the ratio started to decline, as platinum bottomed and later entered a new bull market. The indicator reached the bottom around 0.41 in January 2001, when the bull market in gold started. It means that one ounce of gold could buy less than a half ounce of platinum – and gold was relatively undervalued compared to platinum. Then, the ratio spiked to 0.72 in October 2001, but the downward trend continued until April 2004. It rebounded afterwards slightly, but platinum started its parabolic rise in 2008, pushing the ratio down. The outbreak of the financial crisis then led to a plunge in platinum prices, lifting the ratio almost to unity in December 2008. The behavior of gold and platinum prices then clearly shows that the yellow metal performs like a safehaven asset during financial distress. As platinum prices rebounded, the goldtoplatinum ratio fell, but it started to rise again in April 2010, due to intensified concerns about the European sovereign debt crisis. Interestingly, in September 2011 the ratio reached parity, and gold has been more expensive than platinum for more than a year, which is quite an uncommon phenomenon in the precious metals market. After a correction and fall to 0.85 in June 2014, the ratio started to climb again. In January 2015 it moved above parity again. Thereafter, gold has remained more expensive than platinum, indicating a change in market sentiment towards a more riskoff stance.
What can we learn from the analysis of the historical developments of the goldtoplatinum ratio? For most of the time, the ratio has been below unity. It means that platinum has traded higher than gold, as one ounce of gold has bought less than an ounce of platinum (or just a portion of ounce of platinum has purchased one ounce of gold). It makes perfect sense, as the supply of platinum is lower than the supply of gold (while there used to be strong industrial demand for platinum). However, gold has recently been more expensive than platinum, indicating low confidence in the global economy. This is because gold is mostly a safehaven asset, while platinum is an industrial metal. Thus the goldtoplatinum ratio is a useful indicator of economic confidence among investors. Gold's current premium over platinum reflects increased risk aversion and the economic slowdown. However, the ratio has been declining between the end of January 2016 and May 2016, which could indicate that global fears are easing a bit (which is negative for gold) and that the commodity sector is rebounding. If this trend continues, platinum prices may outperform gold over the next several months.
Let's look at the chart again. Gold tends to outperform platinum when the confidence in the government, economy and fiat money is deteriorating, while it underperforms platinum during periods of monetary stability, economic growth and high confidence in the financial system. Generally, the goldtoplatinum ratio was rising during the boom in the gold market in the 1970s and 2000s, and was declining during the bear market in gold during the 1980s and the 1990s. It peaked at the beginning of the 1980s and bottomed in 2001. Therefore, the recent peak in 2016 is interesting. It suggests that platinum may outperform gold, especially given the recent slight rebound in the commodity sector. However, as the economic confidence remains low, we may expect rises both in platinum and gold prices in the coming years (not necessarily months), just like in the 2000s.
If you enjoyed the above analysis and would you like to know more about the gold to precious metals ratios, we invite you to read the June Market Overview report. If you're interested in the detailed price analysis and price projections with targets, we invite you to sign up for our Gold & Silver Trading Alerts. If you're not ready to subscribe at this time, we invite you to sign up for our gold newsletter and stay uptodate with our latest free articles. It's free and you can unsubscribe anytime.
All essays, research and information found above represent analyses and opinions of Przemyslaw Radomski, CFA and Sunshine Profits' employees and associates only. As such, it may prove wrong and be a subject to change without notice. Opinions and analyses were based on data available to authors of respective essays at the time of writing. Although the information provided above is based on careful research and sources that are believed to be accurate, Przemyslaw Radomski, CFA and his associates do not guarantee the accuracy or thoroughness of the data or information reported. The opinions published above are neither an offer nor a recommendation to purchase or sell any securities. Mr. Radomski is not a Registered Securities Advisor. By reading Przemyslaw Radomski's, CFA reports you fully agree that he will not be held responsible or liable for any decisions you make regarding any information provided in these reports. Investing, trading and speculation in any financial markets may involve high risk of loss. Przemyslaw Radomski, CFA, Sunshine Profits' employees and affiliates as well as members of their families may have a short or long position in any securities, including those mentioned in any of the reports or essays, and may make additional purchases and/or sales of those securities without notice.
Recommended Content
Editors’ Picks
EUR/USD fluctuates in daily range above 1.0600

EUR/USD struggles to gather directional momentum and continues to fluctuate above 1.0600 on Tuesday. The modest improvement seen in risk mood limits the US Dollar's gains as investors await Fed Chairman Jerome Powell's speech.
GBP/USD stabilizes near 1.2450 ahead of Powell speech

GBP/USD holds steady at around 1.2450 after recovering from the multi-month low it touched near 1.2400 in the European morning. The USD struggles to gather strength after disappointing housing data. Market focus shifts to Fed Chairman Powell's appearance.
Gold retreats to $2,370 as US yields push higher

Gold stages a correction on Tuesday and fluctuates in negative territory near $2,370 following Monday's upsurge. The benchmark 10-year US Treasury bond yield continues to push higher above 4.6% and makes it difficult for XAU/USD to gain traction.
XRP struggles below $0.50 resistance as SEC vs. Ripple lawsuit likely to enter final pretrial conference

XRP is struggling with resistance at $0.50 as Ripple and the US Securities and Exchange Commission (SEC) are gearing up for the final pretrial conference on Tuesday at a New York court.
US outperformance continues

The economic divergence between the US and the rest of the world has become increasingly pronounced. The latest US inflation prints highlight that underlying inflation pressures seemingly remain stickier than in most other parts of the world.