Another small green candlestick overall fits the Elliott wave count. The alternate hourly wave count (with a small adjustment) is now much more likely, and so today I am swapping over the main and alternate hourly wave counts.
Summary: The short term target is 1,218. Overall I expect choppy overlapping slowing upwards movement for about another two or three days to complete a leading contracting diagonal. When that is done I expect to see a very deep second wave correction downwards. Alternatively, it is still possible that we may see a strong increase in upwards momentum in the next 24 hours, but this is now less likely. If that happens the target is now at 1,249.
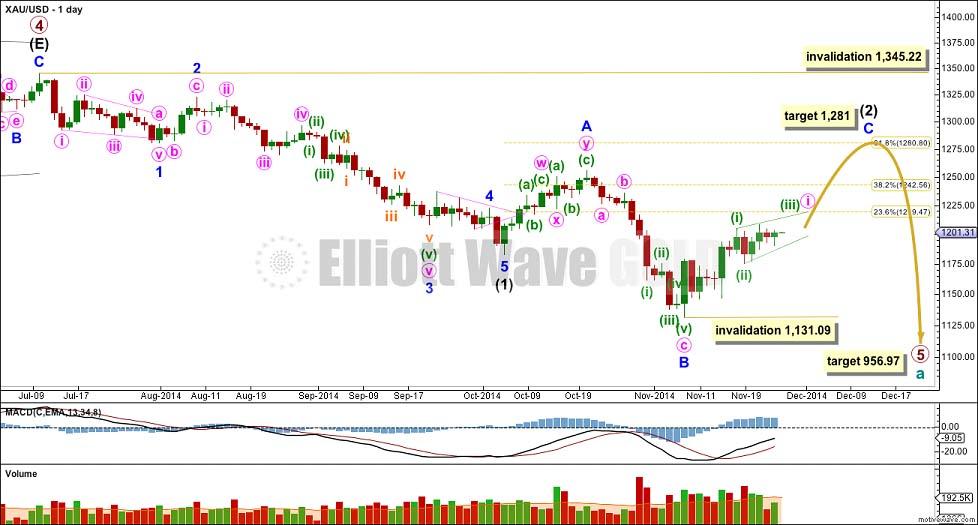
Primary wave 4 is complete and primary wave 5 is unfolding. Primary wave 5 may only subdivide as an impulse or an ending diagonal. So far it looks most likely to be an impulse.
Within primary wave 5 intermediate wave (1) fits perfectly as an impulse. There is perfect alternation within intermediate wave (1): minor wave 2 is a deep zigzag lasting a Fibonacci five days and minor wave 4 is a shallow triangle lasting a Fibonacci eight days, 1.618 the duration of minor wave 2. Minor wave 3 is 9.65 longer than 1.618 the length of minor wave 1, and minor wave 5 is just 0.51 short of 0.618 the length of minor wave 1. I am confident this movement is one complete impulse.
Intermediate wave (2) is an incomplete expanded flat correction. Within it minor wave A is a double zigzag. The downwards wave labelled minor wave B has a corrective count of seven and subdivides perfectly as a zigzag. Minor wave B is a 172% correction of minor wave A. This is longer than the maximum common length for a B wave within a flat correction at 138%, but within the allowable range of less than twice the length of minor wave A. Minor wave C may not exhibit a Fibonacci ratio to minor wave A, and I think the target for it to end would best be calculated at minute degree. At this stage I would expect intermediate wave (2) to end close to the 0.618 Fibonacci ratio of intermediate wave (1) just below 1,281.
Intermediate wave (1) lasted a Fibonacci 13 weeks. So far intermediate wave (2) has just begun its seventh week. I will expect it may continue for another two weeks at least to total a Fibonacci eight, and be 0.618 the duration of intermediate wave (1). Alternatively, intermediate wave (2) may last a total Fibonacci 13 weeks equalling the duration of intermediate wave (1).
The target for primary wave 5 at this stage remains the same. At 956.97 it would reach equality in length with primary wave 1. However, if this target is wrong it may be too low. When intermediate waves (1) through to (4) within it are complete I will calculate the target at intermediate degree and if it changes it may move upwards. This is because waves following triangles tend to be more brief and weak than otherwise expected. A perfect example is on this chart: minor wave 5 to end intermediate wave (1) was particularly short and brief after the triangle of minor wave 4.
Intermediate wave (2) may not move beyond the start of intermediate wave (1) above 1,345.22. I have confidence this price point will not be passed because the structure of primary wave 5 is incomplete because downwards movement from the end of the triangle of primary wave 4 does not fit as either a complete impulse nor an ending diagonal.
To see a prior example of an expanded flat correction for Gold on the daily chart, and an explanation of this structure, go here.
*Note: I am aware (thank you to members) that other Elliott wave analysts are calling now for the end of primary wave 5 at the low at 1,131. I am struggling to see how this downwards movement fits as a five wave impulse: I would label the second wave within it (labelled minor wave 2) intermediate wave (1), and the fourth wave intermediate wave (4) (labelled as a double zigzag for minor wave A). Thus a complete impulse down would have a second wave as a single zigzag and a fourth wave as a double zigzag, which would have inadequate alternation. Finally, the final fifth wave down would be where I have minor wave B within intermediate wave (2). This downwards wave has a cursory count of seven, and I do not think it subdivides as well as an impulse as it does as a zigzag. If any members come across a wave count showing possible subdivisions of a complete primary wave 5 I would be very curious to see it.
Main Hourly Wave Count
I will show hourly charts on a 2 hourly time frame today to fit all this movement in so you can see the differences between this main count and the alternate below.
This was yesterday’s alternate. It has increased in probability, mostly because the other wave count expected an imminent increase in upwards momentum which has not happened.
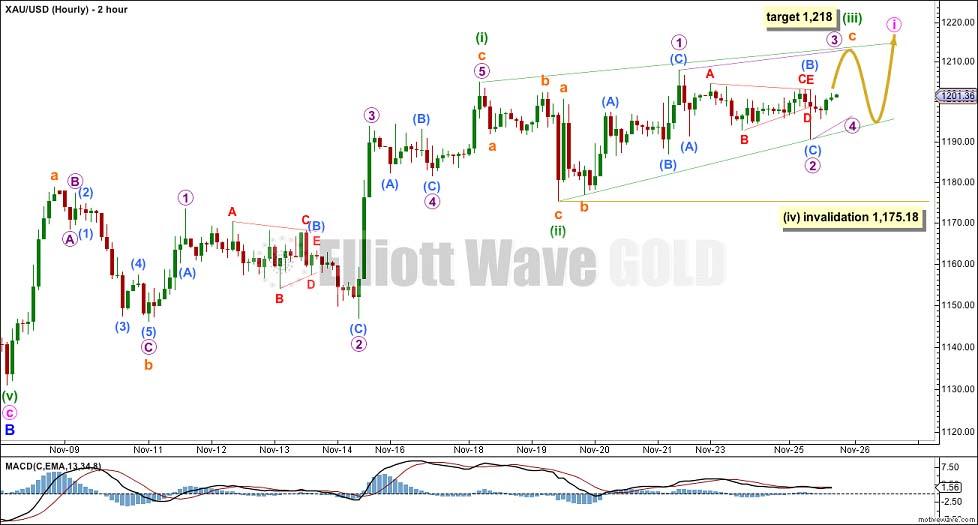
This main hourly wave count expects that minor wave C is beginning with a leading contracting diagonal for minute wave i.
Within this possible diagonal minuette wave (i) is a complete zigzag. Within leading diagonals the first, third and fifth waves are most commonly zigzags, but they may also be impulses.
Minuette wave (ii) is a complete zigzag, but much shallower than the common depth of between 0.66 to 0.81, at only 0.40 of minuette wave (i). This reduces the probability of this wave count, and is a good reason for seriously considering the alternate below.
Within the zigzag of minuette wave (iii) subminuette waves a and b are complete. Subminuette wave c looks like it may be completing as an ending contracting diagonal (it must subdivide as a five). At 1,218 subminuette wave c would reach 1.618 the length of subminuette wave a.
When minuette wave (iii) is a completed zigzag then minuette wave (iv) must overlap back into minuette wave (i) price territory, but may not move below the end of minuette wave (ii) at 1,175.18.
The diagonal is expected to be contracting, so minuette wave (iv) should be shorter than the length of minuette wave (ii) which was 29.59.
If this main hourly wave count is correct then when minute wave i is a completed leading contracting diagonal I would expect a following very deep second wave correction downwards for minute wave ii. When first waves unfold as leading diagonals they are normally followed by very deep second waves.
Alternate Hourly Wave Count
This is a variation on yesterday’s main wave count. Thanks to one of our members, Aleforex, for this idea.
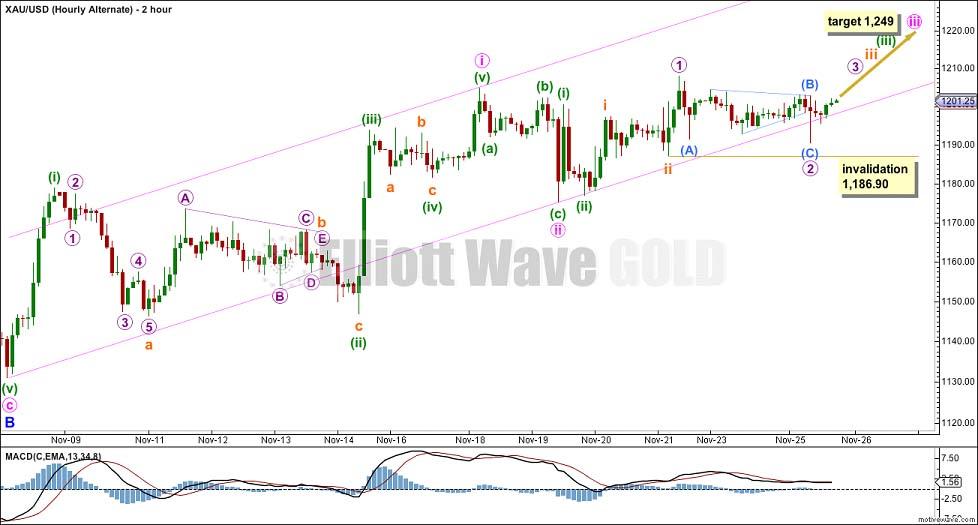
This wave count sees minute wave i as over somewhat higher, as a five wave impulse. Ratios within minute wave i are: minuette wave (iii) is 1.01 short of equality with minuette wave (i), and minuette wave (v) has no Fibonacci ratio to either of minuette waves (i) or (iii). This movement fits with MACD, with minuette wave (iii) having the strongest upwards momentum.
There is a slight truncation at the end of minuette wave (ii): subminuette wave c failed to move below the end of subminuette wave a by 0.73. This slightly reduces the probability of this wave count.
Minute wave ii is a complete zigzag, but it is a shallow correction, only just below the 0.382 Fibonacci ratio of minute wave i. This is only a little unusual, and I would not actually judge it to be unusual enough to reduce the probability of this wave count by much at all.
The problem with this wave count is the same as previously. If the middle of a third wave is approaching we should expect to see a strong increase in upwards momentum. This alternate may yet redeem itself when upwards movement substantially increases in the next 24 hours. If that does occur I would use this again as a main wave count.
At this stage this alternate has an overlapping series of four first and second waves, and requires a strong increase in upwards momentum. At 1,249 minute wave iii would reach equality in length with minute wave i. I am using the ratio of equality to calculate the target because minute wave ii was shallow and minute wave i is long.
The adjustment to this wave count now sees downwards corrections mostly within the new base channel about minute waves i and ii. Only micro wave 2 spikes below the channel. This has a better overall look.
Micro wave 2 may not move beyond the start of micro wave 1 below 1,186.90.
Our service is educational, we aim to teach you how to learn to perform your own Elliott wave analysis.
Recommended Content
Editors’ Picks
AUD/USD holds hot Australian CPI-led gains above 0.6500

AUD/USD consolidates hot Australian CPI data-led strong gains above 0.6500 in early Europe on Wednesday. The Australian CPI rose 1% in QoQ in Q1 against the 0.8% forecast, providing extra legs to the Australian Dollar upside.
USD/JPY sticks to 34-year high near 154.90 as intervention risks loom

USD/JPY is sitting at a multi-decade high of 154.88 reached on Tuesday. Traders refrain from placing fresh bets on the pair as Japan's FX intervention risks loom. Broad US Dollar weakness also caps the upside in the major. US Durable Goods data are next on tap.
Gold price struggles to lure buyers amid positive risk tone, reduced Fed rate cut bets

Gold price lacks follow-through buying and is influenced by a combination of diverging forces. Easing geopolitical tensions continue to undermine demand for the safe-haven precious metal. Tuesday’s dismal US PMIs weigh on the USD and lend support ahead of the key US macro data.
Crypto community reacts as BRICS considers launching stablecoin for international trade settlement

BRICS is intensifying efforts to reduce its reliance on the US dollar after plans for its stablecoin effort surfaced online on Tuesday. Most people expect the stablecoin to be backed by gold, considering BRICS nations have been accumulating large holdings of the commodity.
US versus the Eurozone: Inflation divergence causes monetary desynchronization

Historically there is a very close correlation between changes in US Treasury yields and German Bund yields. This is relevant at the current juncture, considering that the recent hawkish twist in the tone of the Fed might continue to push US long-term interest rates higher and put upward pressure on bond yields in the Eurozone.


