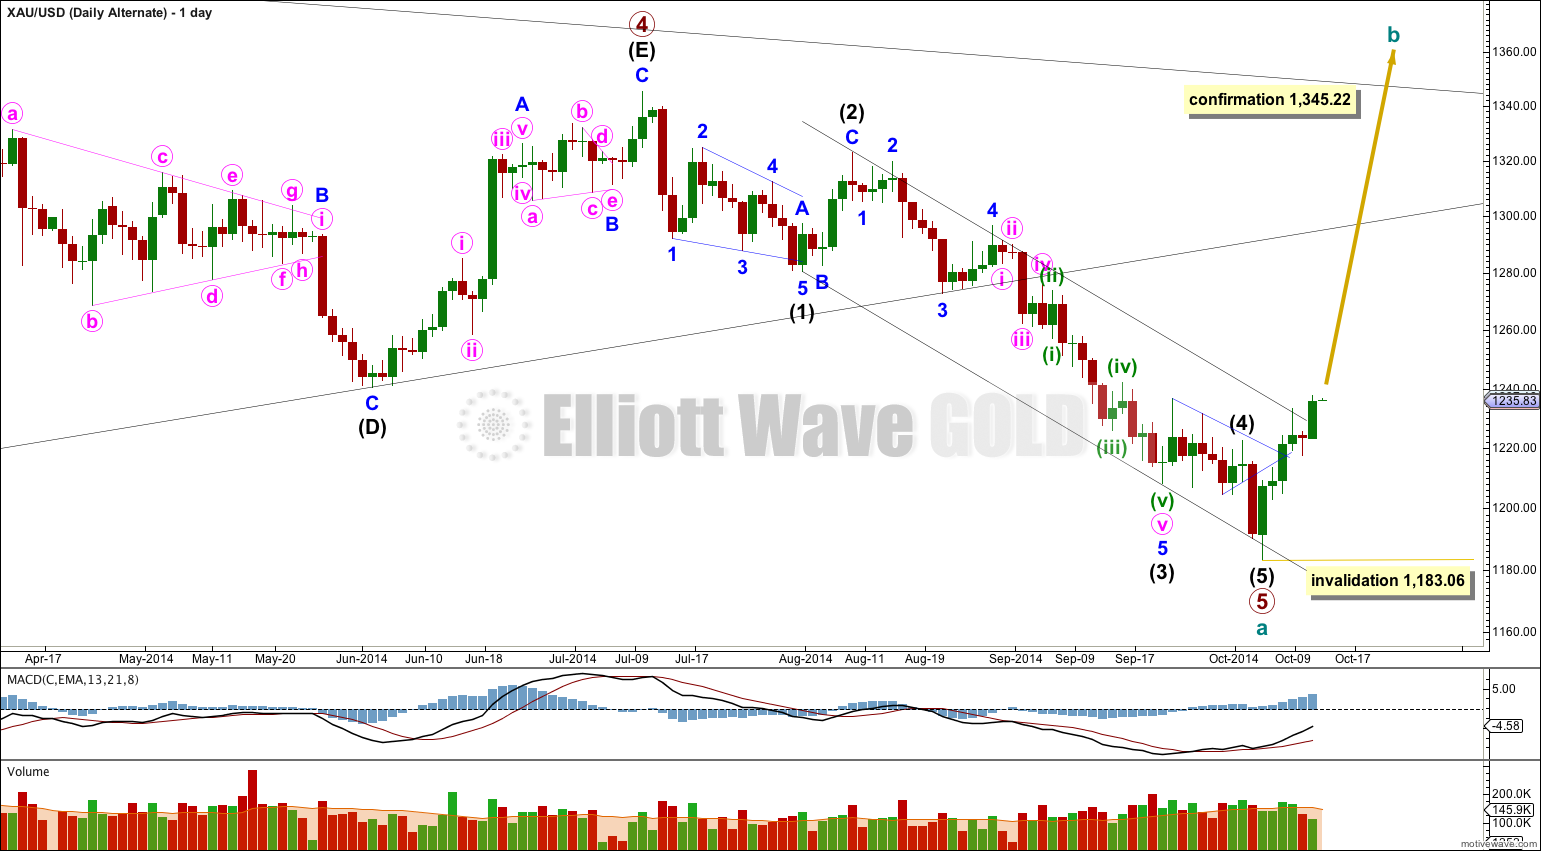
Upwards movement was expected to reach 1,243 – 1,245. Price fell 4.64 short of the target before turning downwards.
Summary: Downwards movement should continue a little further to 1,222, although it may move lower than this.
Main Wave Count
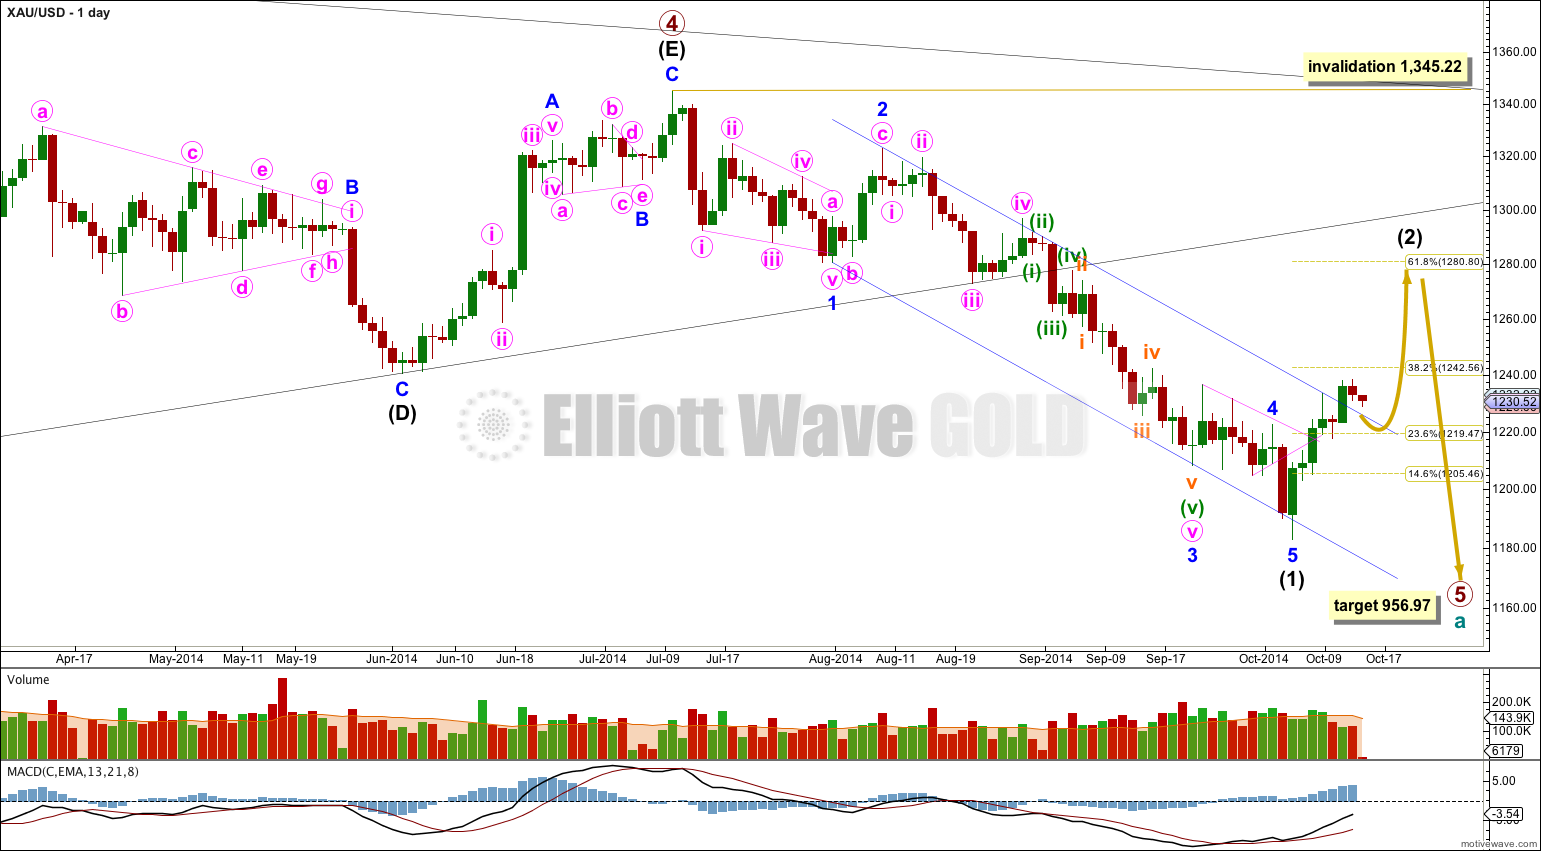
On the weekly chart extend the triangle trend lines of primary wave 4 outwards. The point in time at which they cross over may be the point in time at which primary wave 5 ends. This does not always work, but it works often enough to look out for. It is a rough guideline only and not definitive. A trend line placed from the end of primary wave 4 to the target of primary wave 5 at this point in time shows primary wave 5 would take a total 26 weeks to reach that point, and that is what I will expect. Primary wave 5 is in its 14th week.
At 956.97 primary wave 5 would reach equality in length with primary wave 1. Primary wave 3 is $12.54 short of 1.618 the length of primary wave 1, and equality between primary waves 5 and 1 would give a perfect Elliott relationship for this downwards movement.
However, when triangles take their time and move close to the apex of the triangle, as primary wave 4 has, the movement following the triangle is often shorter and weaker than expected, and this is my main reason for presenting the alternate wave count to you. If the target at 956.97 is wrong it may be too low. In the first instance I expect it is extremely likely that primary wave 5 will move at least below the end of primary wave 3 at 1,180.40 to avoid a truncation. When intermediate waves (1) through to (4) within primary wave 5 are complete I will recalculate the target at intermediate degree because this would have a higher accuracy. I cannot do that yet; I can only calculate it at primary degree.
Movement comfortably below 1,180.84 would provide further confidence in this main wave count as at that stage an alternate idea which sees primary wave 4 as continuing as a barrier triangle would be invalidated.
Draw a channel about intermediate wave (1): draw the first trend line from the lows labeled minor waves 1 to 3, then place a copy on the high labeled minor wave 2. The slight overshoot of the lower edge of this channel indicates minor wave 5 may be over there. Intermediate wave (2) has just breached upper edge of this channel, and this trend line is now providing support.
Intermediate wave (2) may end close to a Fibonacci ratio of intermediate wave (1). Only because second waves are more commonly deep than shallow is the 0.618 ratio at 1,280.80 slightly favoured. But it does not have to be this deep. When I know where minor waves A and B within this correction have ended then a target should be calculated using the ratio between minor waves A and C.
At this stage I have three hourly wave counts for you which look at three different corrective structures for intermediate wave (2). I present them in order of probability: a double zigzag is most likely, followed by a single zigzag, and last a flat correction.
Double Zigzag or Double Combination
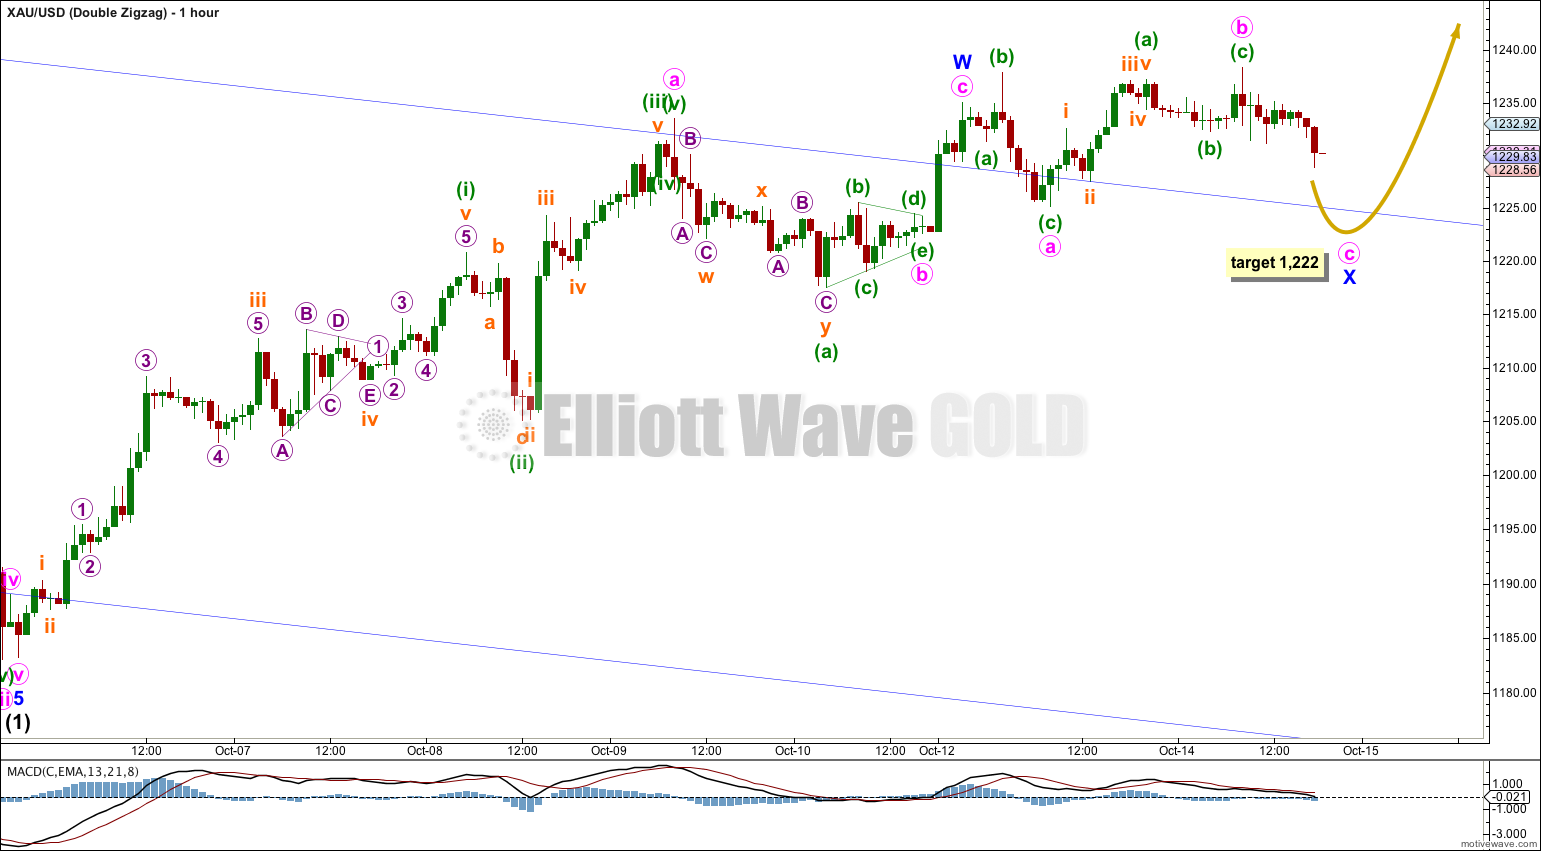
Upwards movement may have been a single zigzag labeled minor wave W, and this may be followed by an expanded flat correction for minor wave X. X waves may be any corrective structure (including a multiple) but they are most often single zigzags. This one looks like a flat correction. Within it minute wave b is a 134% correction of minute wave a. At 1,222 minute wave c would reach 1.618 the length of minute wave a. Minute wave c may continue to follow support at the upper blue trend line copied over here from the daily chart.
If minor wave W was a zigzag then intermediate wave (2) is either a double zigzag or a combination. At this stage a double zigzag would be most likely if minor wave X is shallow, and a double zigzag would also make sense at the daily chart level as a second zigzag looks likely to deepen the correction. I would expect intermediate wave (2) to most likely be deeper than the 0.382 Fibonacci ratio of intermediate wave (1).
Within minor wave W minute wave c is 0.61 longer than 0.236 the length of minute wave a.
Within minute wave a there are no adequate Fibonacci ratios between minuette waves (i), (iii) and (v).
This wave count fits with MACD. Within minute wave a it is the third wave which has the strongest momentum. Within minute wave b triangle MACD hovers about the zero line. All the subdivisions fit perfectly. This wave count has no problems. For this reason it is my preferred wave count.
If intermediate wave (2) is a double zigzag then minor wave X is most likely to be shallow. If intermediate wave (2) is a double combination then minor wave X would be deep. There is no lower invalidation point for this wave count; minor wave X may make a new low below the start of minor wave W.
Single Zigzag
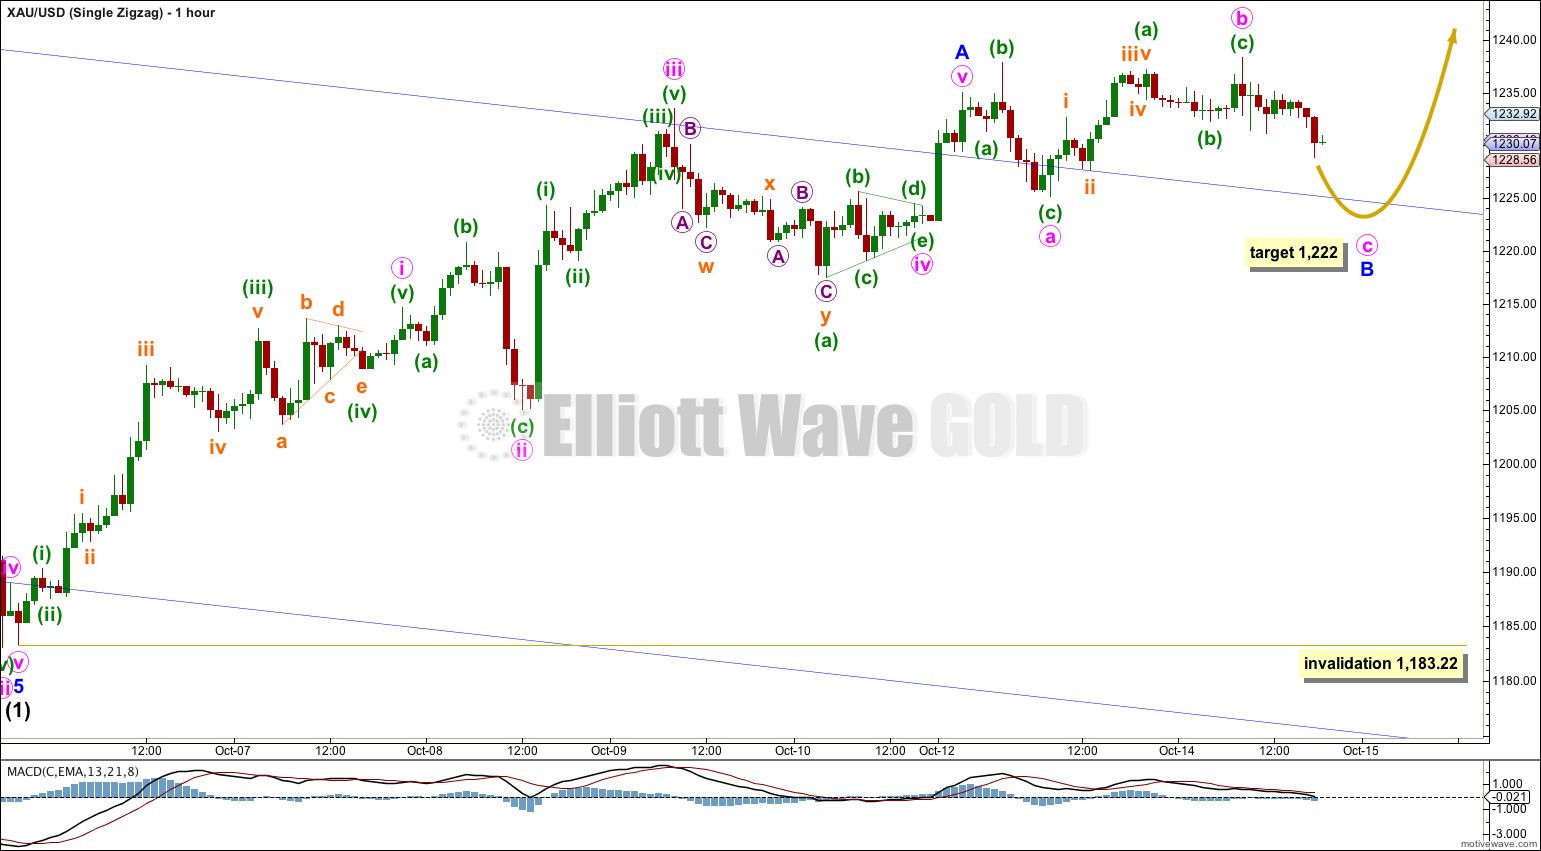
It is still possible that intermediate wave (2) is a single zigzag. Minor wave A can be seen as a complete five wave impulse.
Within minor wave A minute wave ii is an expanded flat correction. Within that expanded flat minuette wave (c) looks more like a three than a five. This is only problem with this wave count.
Within minor wave A minute wave iv fits as a triangle and this is supported by MACD. This provides alternation with the flat of minute wave ii.
Ratios within minor wave A are: minute wave iii has no Fibonacci ratio to minute wave i, and minute wave v is 0.48 longer than 0.382 the length of minute wave i.
Minor wave B may be an incomplete expanded flat correction, and the subdivisions here are exactly the same as the first hourly wave count and the target is the same.
If intermediate wave (2) is a single zigzag then within it minor wave B may not move beyond the start of minor wave A below 1,183.22.
Flat
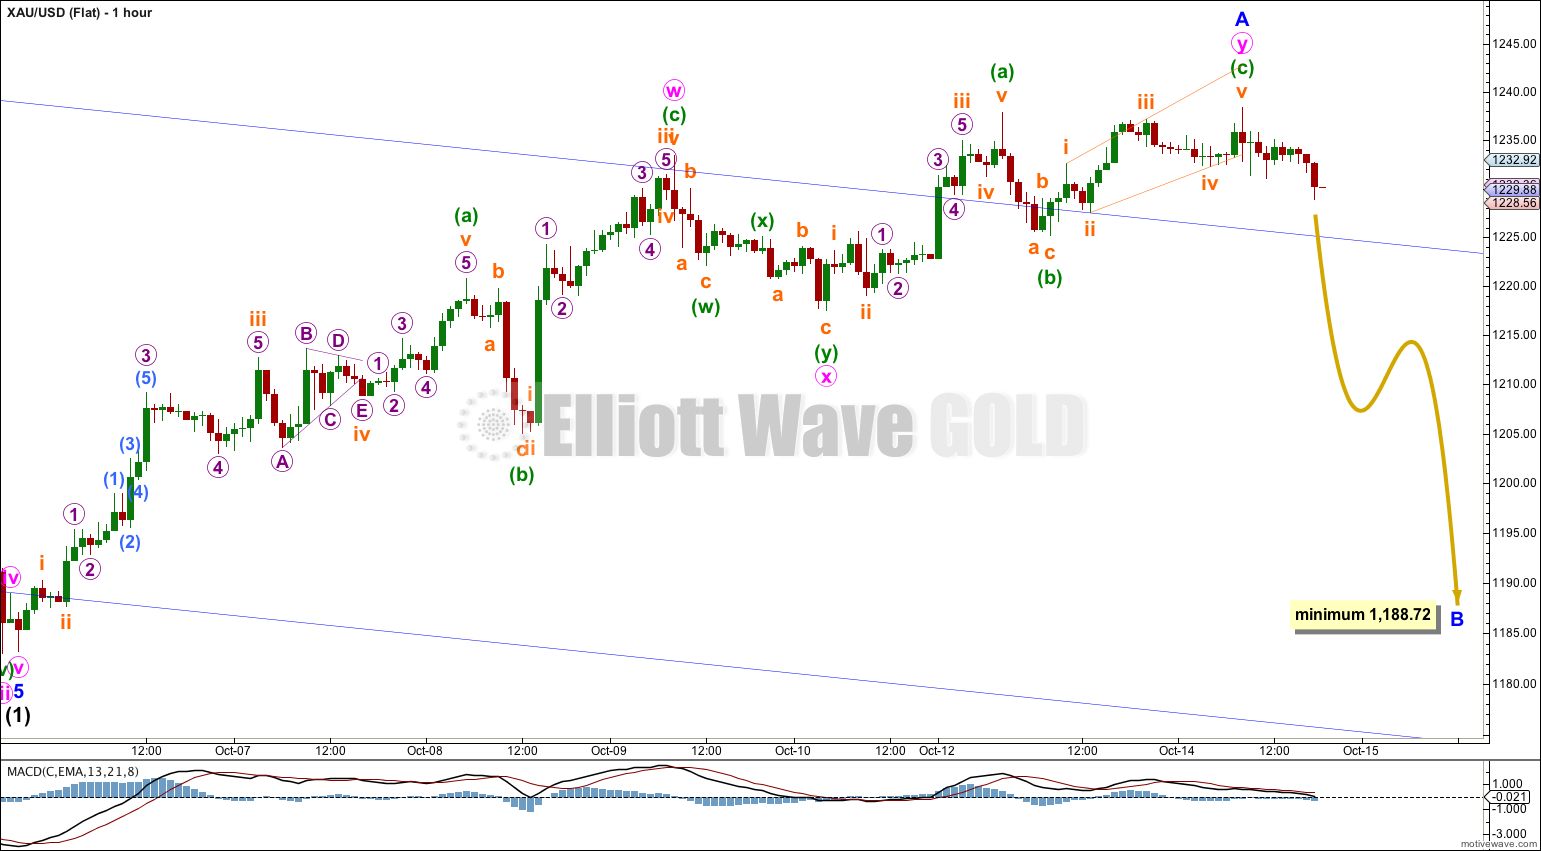
This wave count follows on from the first hourly wave count for last analysis. If minor wave A is a double zigzag then intermediate wave (2) may be a flat correction.
The problem with this wave count now and the reason why it is the least likely is the structure of minuette wave (c) within the second zigzag of minute wave y. This upwards movement does not fit as an impulse, and as an ending diagonal the fifth wave is too short. This is a significant problem with greatly reduces the probability of this wave count, maybe to about only 10%.
If intermediate wave (2) is a flat correction then within it minor wave B must move back down to a minimum 90% length of minor wave A at 1,188.72 or below. Minor wave B may make a new low below the start of minor wave A. There is no lower invalidation point for this wave count.
Alternate Wave Count
By simply moving the degree of labeling within primary wave 5 downwards all up one degree it is possible that primary wave 5 and so cycle wave a are over.
This wave count is reduced in probability by a small truncation. Primary wave 5 would be truncated by $2.66. The truncation is small though, so this wave count must be considered.
Movements out of triangles are often more brief and weak than expected, sometimes they are surprisingly brief.
If price breaks out of the upper edge of the parallel channel about cycle wave a (look to the weekly chart for this channel) this would be first indication that this wave count is correct. This trend channel confirmation would come before price confirmation above 1,345.22.
The first movement upwards for cycle wave b should be a five wave structure. Within it no second wave correction may move beyond the start of its first wave below 1,183.06.
Movement above 1,345.22 would invalidate the main wave count and confirm this alternate.
Our service is educational, we aim to teach you how to learn to perform your own Elliott wave analysis.
Recommended Content
Editors’ Picks
AUD/USD remained bid above 0.6500

AUD/USD extended further its bullish performance, advancing for the fourth session in a row on Thursday, although a sustainable breakout of the key 200-day SMA at 0.6526 still remain elusive.
EUR/USD faces a minor resistance near at 1.0750

EUR/USD quickly left behind Wednesday’s small downtick and resumed its uptrend north of 1.0700 the figure, always on the back of the persistent sell-off in the US Dollar ahead of key PCE data on Friday.
Gold holds around $2,330 after dismal US data

Gold fell below $2,320 in the early American session as US yields shot higher after the data showed a significant increase in the US GDP price deflator in Q1. With safe-haven flows dominating the markets, however, XAU/USD reversed its direction and rose above $2,340.
Bitcoin price continues to get rejected from $65K resistance as SEC delays decision on spot BTC ETF options

Bitcoin (BTC) price has markets in disarray, provoking a broader market crash as it slumped to the $62,000 range on Thursday. Meanwhile, reverberations from spot BTC exchange-traded funds (ETFs) continue to influence the market.
US economy: slower growth with stronger inflation

The dollar strengthened, and stocks fell after statistical data from the US. The focus was on the preliminary estimate of GDP for the first quarter. Annualised quarterly growth came in at just 1.6%, down from the 2.5% and 3.4% previously forecast.
