Briefly: In our opinion speculative long positions (half) in gold, silver and mining stocks are justified from the risk/reward perspective.
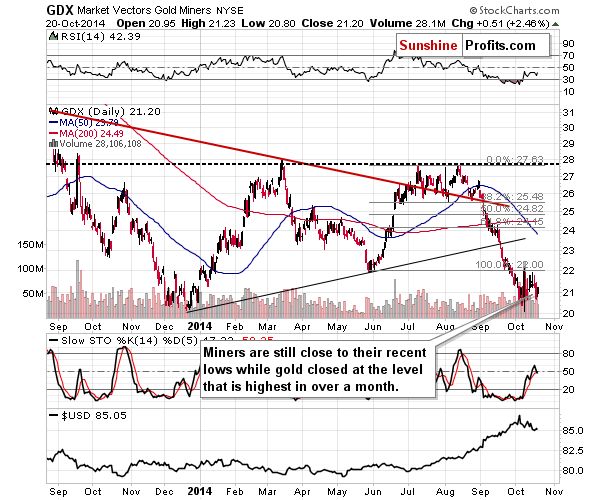
Yesterday, gold closed higher than it did in the previous several weeks, which seems like a very bullish development for the entire precious metals market until one realizes that miners are still close to their most recent lows.
In short, in our opinion, the answer to the title question is that miners could rally some more in the short term, but we don’t expect the rally to be significant. We expect to see significant rallies after the final bottom is reached (in a few weeks – months), but not before that – at least not based on the information that we have available today. Furthermore, it seems that the next local top will be reached shortly, but that it’s not in just yet.
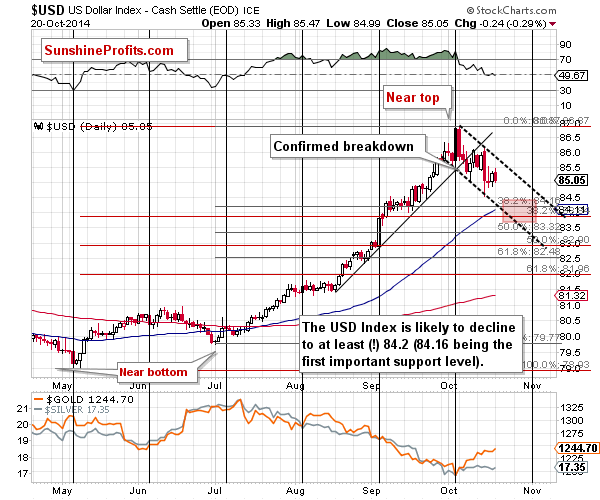
Why? The USD Index is likely not done declining and the long-term resistance lines in gold have not been reached. What we wrote about these markets yesterday and on Friday remains up-to-date. Still, we would like to show you the latest short-term USD chart as we have added a target area to it (charts courtesy of http://stockcharts.com).
The target area is relatively close in terms of both time and price. Most of the decline is probably behind us. We have previously written that we expect the USD Index to correct to the 38.2% Fibonacci retracement level and the biggest unknown is what the retracement should be based on – the May-Oct. or Jul.-Oct. rally. The former seems a bit more likely because the 38.2% based on the May-Oct. rally coincides with the 50- day moving average (blue line on the above chart).
As we have mentioned earlier, gold closed higher once again, which allowed for closing part of the long positions with greater profit yesterday.
As a reminder, we took previous profits off the table by closing short positions on Sep. 25 and we went long with half of the regular position on the same day (gold closed at $1,222.50, but the intra-day low was $1,206.60 and we changed the positions well before the markets closed). On Sep. 30 (when silver was below $17 and gold closed at $1,209.10) we wrote about doubling the long positions.
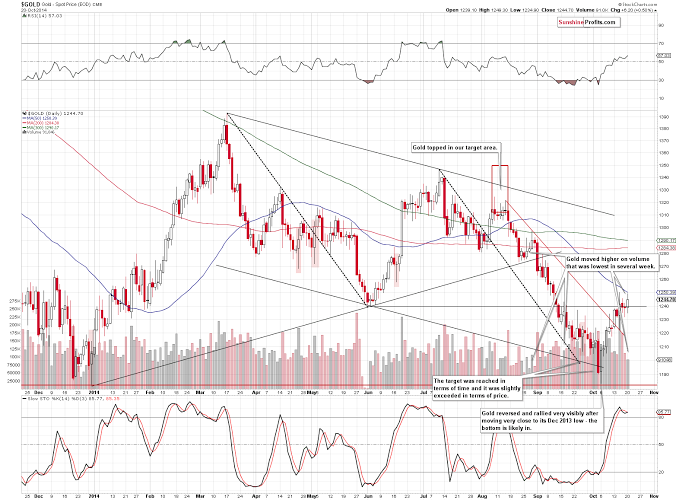
Yesterday’s move, however, materialized on relatively low volume. It was lowest in a few weeks, so the rally itself was not bullish. The price-volume combination suggests that the rally is running out of steam and the local top is close. This is in tune with what we can infer from the USD Index charts and from the long-term gold chart.
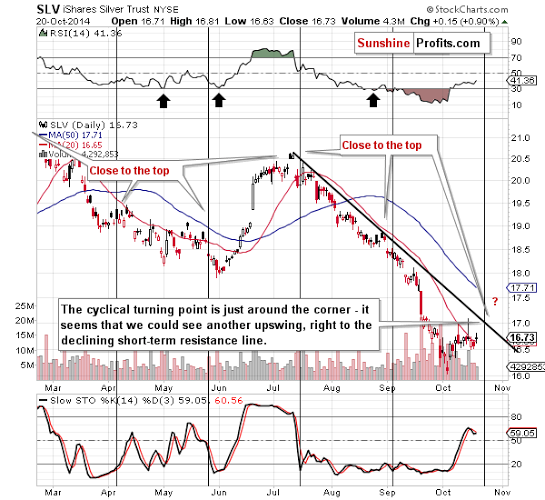
The USD Index is not the only thing that moves in cycles. The silver market has a cyclical nature as well. The white metal is likely to turn around in the next several days, and the most recent short-term move has been up. Consequently, we are quite likely to see a local top relatively soon.
The declining resistance line is now relatively close – about $0.27 away and more or less at the previous intra-day Oct high. Consequently, we could see the local top more or less at this price level. It seems that it would quite likely coincide with gold moving to its target price.
Now, in the case of mining stocks, what we see on the above chart per se is less important than what we learn when we compare it with the chart of gold. The above chart tells us that miners rallied yesterday, but the miners-gold link tells us that miners are still weak. This is particularly discouraging because the general stock market moved higher once again yesterday. In other words, we saw Friday’s bearish signal once again – miners did not soar or catch up with gold, even though they “should have”.
Overall, we can summarize the situation in gold, silver and mining stocks in a way that is similar to what we wrote yesterday. However, before we write the final paragraph, we would like to reply to a few questions that we received yesterday.
The first one is “how will you know we reach the final bottom for precious metals and the mining stocks? Will $1,000 and $14 be the final one or could we see a rebound and another plunge lower?” Our reply is similar to what we have written previously. We will be looking for confirmations at these levels. Significant support levels in gold and silver being reached – this is one thing that is likely to be seen at the final bottom, but there are also other things that we would like to see:
- We would like to see USD Index at a major resistance level. - We would like to see the gold stocks to gold ratio plunge (but we would like gold stocks to show strength after a while, thus refusing to follow gold’s declines). - We would like to see the silver to gold ratio plunge very visibly (to the point that it’s scary and most investors/traders panic). - We would like to see websites dedicated to gold freeze for a while when people are so interested in the volatile downswing and keep refreshing these websites for latest prices (did you know that something like that occurred in 2011 right before the final top?). - We would like to see a very bearish (preferably hateful or otherwise emotional) article on gold in the mainstream media. - We would like our non-investing friends to call us asking what’s going on with gold as they’ve heard that it has declined so badly. - We will see other sings that investors and traders sentiment toward gold is very bad.
In other words, we will be looking for confirmations that the bottom is in. The price itself is not enough. At this time it seems that the $1,000 - $1,100 area for gold, $14 - $16 for silver and 150 or so for the HUI Index will stop the decline, but there are no sure bets in any market. We will keep monitoring the situation and report to you accordingly.
The second question that we received is if we will let you know when we think the final bottom is in and if we will plan to take advantage of it using ETFs or quality mining stocks. The answer to the first questions is “yes”. In more detail, we will let you know when we think that the situation looks favorable enough to get back into the precious metals market with the long-term investment capital and when to open speculative long positions. As far as ETFs / mining stocks are concerned, we will quite likely use both.
We will most likely use ETFs / ETNs for speculation in the case of gold and silver (trading capital) and we will use quality mining stocks for investment purposes (individual mining stocks are also useful in the case of speculative trades).
In general - as you have read in the bottom part of each recent alert - we are now out of the precious metals market with the long-term investment capital. The gold & silver portfolio report shows you how the portfolio looked (in case of 3 sample investors: Eric, Jill, and John) before we exited the long-term positions. When we come back to the precious metals market, you can expect a similar structure. We will probably move more into platinum than we will into gold, though.
The third question was what stocks we prefer to buy when we think the bottom is in. The short answer is - the ones with the best outlook. How do we determine that? Using the Golden StockPicker and Silver StockPicker tools. We created these tools a few years ago based on our experience and insights and we have tested their performance several months ago - they have proven to be very helpful in case of both: selecting stocks for speculative trades, and in case of long-term investments.
Each day these tools create rankings of stocks based on their recent performance relative to gold. If they don’t give you the big bang for your gold-and-silverexposure- seeking buck, stocks rank lower. If they do, and they provide leverage, they rank higher.
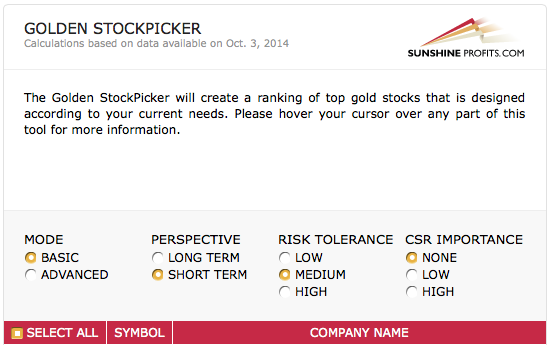
There are multiple ways to use these tools, but in short, for long-term investment purposes, the aim - in most cases - is to buy the best 5 stocks and then rebalance them (every 20 trading days in the case of silver stocks and every 50 trading days in the case of gold stocks). This approach created a lot of value as compared to the simple buy-and-hold approach. We conducted very thorough research on rebalancing mining stocks (the most comprehensive there is, to our knowledge) and you can read the corresponding report in our reports section. The report also features a few approaches regarding speculative purposes. In most cases, selecting top 2 mining stocks seems justified. For instance, take the current/last trade. We wanted to provide you with an example of how the Golden StockPicker works so we saved its results that were based on the Oct. 3 session.
Here’s the input screen:
Here’s the output screen (top 5 stocks):
The top 2 gold stocks were: GOLD and RGLD. The above readings were available on Oct. 6 so we will take Oct. 6 and yesterday’s (Oct. 20) closing prices into account.
The HUI Index moved from 193.49 to 191.16 (thus moving lower by about 1.2%). At the same time, GOLD moved from $67.23 to $68.55 (thus moving about 2% higher) and RGLD moved from $65.36 to $68.04 (thus moving about 4.1% higher).
Of course, these tools are no crystal balls and they will not select top performers each and every time, but - as we have shown in the rebalancing report - they are very likely to improve the results that one gets on the mining stock trades.
To summarize, when the risk/reward ratio is favorable enough to get back in the precious metals market with the long-term investment capital, Golden StockPicker and Silver StockPicker will provide the mining stock rankings.
Recommended Content
Editors’ Picks
EUR/USD clings to daily gains above 1.0650

EUR/USD gained traction and turned positive on the day above 1.0650. The improvement seen in risk mood following the earlier flight to safety weighs on the US Dollar ahead of the weekend and helps the pair push higher.
GBP/USD recovers toward 1.2450 after UK Retail Sales data

GBP/USD reversed its direction and advanced to the 1.2450 area after touching a fresh multi-month low below 1.2400 in the Asian session. The positive shift seen in risk mood on easing fears over a deepening Iran-Israel conflict supports the pair.
Gold holds steady at around $2,380 following earlier spike

Gold stabilized near $2,380 after spiking above $2,400 with the immediate reaction to reports of Israel striking Iran. Meanwhile, the pullback seen in the US Treasury bond yields helps XAU/USD hold its ground.
Bitcoin Weekly Forecast: BTC post-halving rally could be partially priced in Premium

Bitcoin price shows no signs of directional bias while it holds above $60,000. The fourth BTC halving is partially priced in, according to Deutsche Bank’s research.
Week ahead – US GDP and BoJ decision on top of next week’s agenda

US GDP, core PCE and PMIs the next tests for the Dollar. Investors await BoJ for guidance about next rate hike. EU and UK PMIs, as well as Australian CPIs also on tap.
