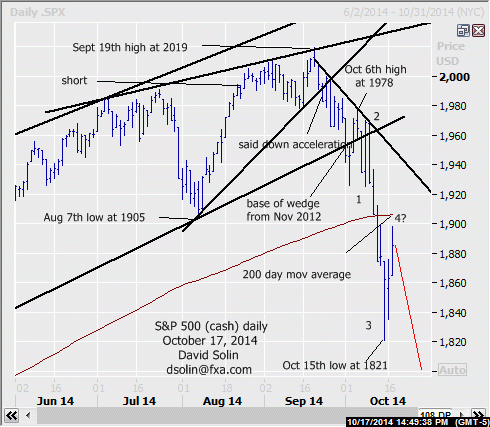
S&P 500 (cash) near term outlook:
In the Oct 10th email, once again affirmed the view from the Sept 23rd email of a top (potentially more major top) and with scope for a sharp, downside acceleration ahead, as the market had resolved lower from the rising wedges from both July 2013 and Nov 2012 (reversal patterns that resolve sharply). The market did indeed tumble from there, reaching a low at 1821 on Oct 15th and before bouncing. However, the nearer term downside pattern from at least the Oct 6th high at 1978 is not "complete" (wave 4, see numbering on daily chart below), and suggests a resumption of the declines after (within wave 5). Note too that time cycles point lower into at least Nov (previously discussed Bradley model), no bottom is seen in oil (at least so far, see scrolling blog at http://www.fxa.com/solin/comments.htm ,email me at [email protected] if you need a password), lots of longer term negatives remain (see longer term below), and markets are rarely that "easy" (the 1821 low was almost exactly a 10% pullback from the Sept 19th high at 2019 as many had expect to be the limit of the downside, contrary indicator). Lots of resistance is in seen in the 1895/05 area (earlier high, 38% from the 2019 high, 200 day moving average). Bottom line : view of a declines (potential plunge) into at least the late Oct timeframe and even late Nov, still playing out.
Near term strategy/position:
Reached the sell target from the Aug 15th email at 1990 on Aug 21st. For now, would continue to stop a close 5 pts above that bearish trendline from Sept 20th to allow for nearby volatility, but getting more aggressive on further declines.
Long term outlook:
As discussed above, a more major top may also be in place (for 9-12 months or more), as lots of longer term negatives remain. These negatives include a still overbought market after the huge surge from the March 2009 low at 667, have likely completed the final upleg in the rally from at least the Oct 2011 low at 1075 (wave V, see numbering on weekly chart below), a downside resolution of the previously discussed "wedge in a wedge", downside pattern from the high not "complete", and a rolling over from the test of the ceiling of the huge channel from that 2006 low (see weekly chart/2nd chart below). Key longer term support below the recent 1821 low is seen at the bullish trendline from Oct 2011 (currently at 1790/00) and 1660/1770 (base of bull channel from March 2009 low at 667 and a 38% retracement from that Oct 2011 low at 1075). Bottom line : more major top also seen in place with potential for eventual declines to an initial 1660/70.
Long term strategy/position:
Also switched the longer term bias to the bearish side on Aug 21st at 1990.
Recommended Content
Editors’ Picks
EUR/USD clings to gains near 1.0700, awaits key US data

EUR/USD clings to gains near the 1.0700 level in early Europe on Thursday. Renewed US Dollar weakness offsets the risk-off market environment, supporting the pair ahead of the key US GDP and PCE inflation data.
USD/JPY keeps pushing higher, eyes 156.00 ahead of US GDP data

USD/JPY keeps breaking into its highest chart territory since June of 1990 early Thursday, recapturing 155.50 for the first time in 34 years as the Japanese Yen remains vulnerable, despite looming intervention risks. The focus shifts to Thursday's US GDP report and the BoJ decision on Friday.
Gold closes below key $2,318 support, US GDP holds the key

Gold price is breathing a sigh of relief early Thursday after testing offers near $2,315 once again. Broad risk-aversion seems to be helping Gold find a floor, as traders refrain from placing any fresh directional bets on the bright metal ahead of the preliminary reading of the US first-quarter GDP due later on Thursday.
Injective price weakness persists despite over 5.9 million INJ tokens burned

Injective price is trading with a bearish bias, stuck in the lower section of the market range. The bearish outlook abounds despite the network's deflationary efforts to pump the price.
Meta takes a guidance slide amidst the battle between yields and earnings

Meta's disappointing outlook cast doubt on whether the market's enthusiasm for artificial intelligence. Investors now brace for significant macroeconomic challenges ahead, particularly with the release of first-quarter GDP data.
