Near term US 10 year note yield outlook:
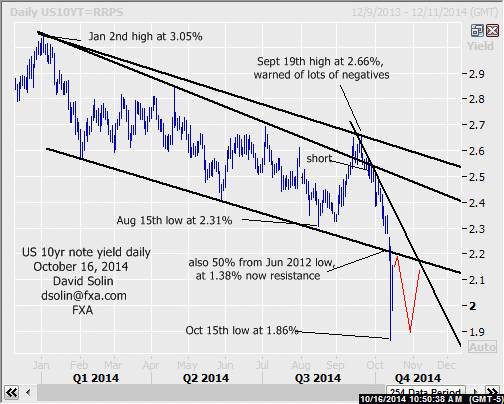
In the Oct 9th email, once again affirmed the bearish view (in the Sept 19th email said at least a few weeks of downside was favored). The market has indeed continued lower since, yesterday spiking below that long discussed 2.18/22% area (both the base of the bear channel since Jan and a 50% retracement from the June 2012 low at 1.38%, see daily chart below, now resistance). No doubt the market is oversold after the tumble from the Sept 19th high at 2.66%, and may have entered of period (at least a few weeks) of consolidating. Note too that markets will often retest these "spike" levels and adds to the potential for at least a few weeks of consolidating (see "ideal" scenario in red on daily chart below). Nearby resistance is seen at the key, broken 2.18/22% area and the bearish trendline from Sept (currently at 2.38/40%). Support is seen at 2.03/05% (on a closing basis, both the bullish trendline and 62% retracement from that June 2012 low at 1.38%) and yesterday's spike low at 1.84/86%.
Bottom line : likely few weeks of ranging (as broad as 1.86/2.20%), no confirmation of a more important low.
Strategy/position:
Still short yield from the Sept 26th sell at 2.53% and given the risk for a few weeks of broad consolidating, would use a wide stop on a close above 2.27% (above that 2.20% resistance area). A final note, if a bit shorter term can look to fade extremes ("ideally" 1.86/2.20%), and then be aggressive with trailing in an attempt to capture some of the expected shorter term swings as the market consolidates.
Long term outlook:
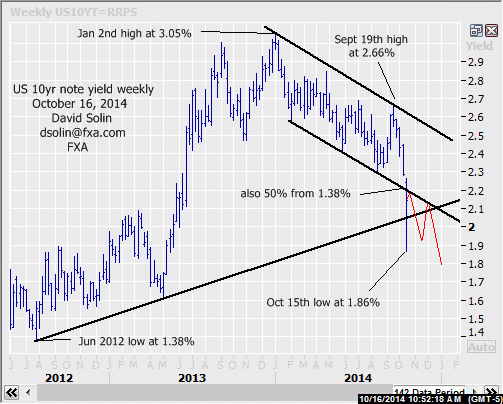
The market did indeed finally reach that long discussed 2.20% area, barely hesitating before spiking below. Though there is scope for at least a few weeks of consolidating (see shorter term above), there is still no confirmation of a more important low. Note too that the long discussed bigger picture negatives remain, and in turn argues further declines after. Those negatives include a continued bearish outlook for stocks (view of tumble into late Oct and more major top for at least 9-12 months, see last week's email, contact me at [email protected] is you need a copy), the seasonal chart that declines into the end of the year (see 3rd chart below), and the still mostly positive sentiment in yield (contrary indicator). Bottom line : at least a few weeks of consolidating, but still no major bottom seen.
Strategy/position:
With no confirmation of a more major bottom and the market quickly nearing that key 2.20% resistance area, would switch the longer term bias to the bearish side here (currently at 2.15%).
Current:
Nearer term: short Sept 26th at 2.53%, scope for a few weeks of wide consolidating ahead.
Last: long Sept 12th at 2.61%, stopped Sept 23rd at 2.53%.
Longer term: bearish bias Oct 16th at 2.15, no major bottom seen (so far).
Last: neutral Sept 26 at 2.53% from bull Sept 12 at 2.61%, risk of more basing toward 2.31%.
Recommended Content
Editors’ Picks
AUD/USD remained bid above 0.6500

AUD/USD extended further its bullish performance, advancing for the fourth session in a row on Thursday, although a sustainable breakout of the key 200-day SMA at 0.6526 still remain elusive.
EUR/USD faces a minor resistance near at 1.0750

EUR/USD quickly left behind Wednesday’s small downtick and resumed its uptrend north of 1.0700 the figure, always on the back of the persistent sell-off in the US Dollar ahead of key PCE data on Friday.
Gold holds around $2,330 after dismal US data

Gold fell below $2,320 in the early American session as US yields shot higher after the data showed a significant increase in the US GDP price deflator in Q1. With safe-haven flows dominating the markets, however, XAU/USD reversed its direction and rose above $2,340.
Bitcoin price continues to get rejected from $65K resistance as SEC delays decision on spot BTC ETF options

Bitcoin (BTC) price has markets in disarray, provoking a broader market crash as it slumped to the $62,000 range on Thursday. Meanwhile, reverberations from spot BTC exchange-traded funds (ETFs) continue to influence the market.
US economy: slower growth with stronger inflation

The dollar strengthened, and stocks fell after statistical data from the US. The focus was on the preliminary estimate of GDP for the first quarter. Annualised quarterly growth came in at just 1.6%, down from the 2.5% and 3.4% previously forecast.

