Technical Analysis
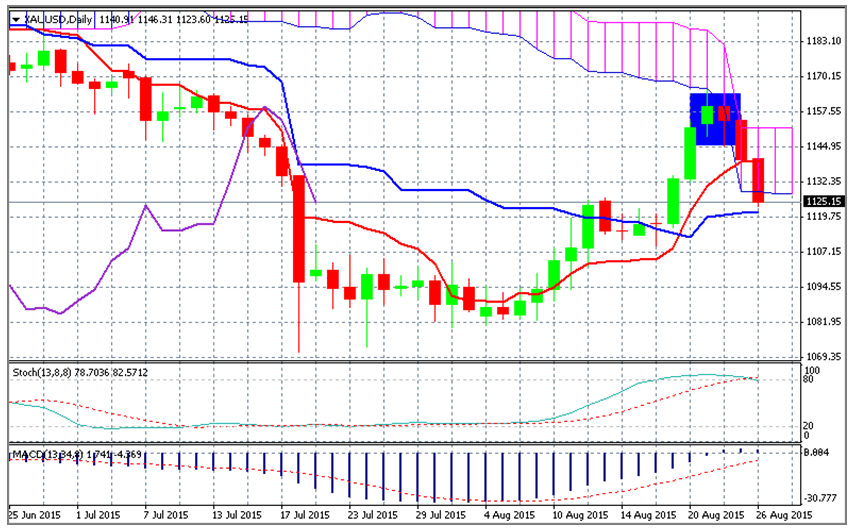
From the gold day-chart we can see last Friday’s and this Monday’s candles have formed a double top formation (blue area), this is usually an indication of trend reversal. It also coincided with the Ichimoku cloud (vertical pink lined area) which acts as a resistance area. Looking at the Stochastic Oscillator we can see that price is beginning to look like it has reached overbought territory. I wouldn’t be surprised to see price continue its correction downwards, or return to its original bear trend, over the next week. The MACD is still showing upward momentum, but that is in contradiction to the last three days, which dictates further weakness may yet to come.
The following examples traded on the ORE web-platform explain how to take advantage of gold price action with Options.
Trade 1 - Trading an Uptrend
If you think the rally in gold is set to continue over the next week then you may buy a Call option, which gives you the right to buy gold at a specific price (strike) with a specific date (expiry). As you can see from the screenshot a Call option to buy 10 ounces of gold at $1124.07 strike, over the next 7 days would cost you 119.92 USD, which is your maximum risk. As the price of gold rises above the strike price $1124.07, the option’s value will rise and you may profit. You may also close the position before expiry to lock-in a profit or loss.
Trade 2 - Trading a downtrend
On the other hand, if you think that the price of gold will continue to fall over the coming week then you may buy a Put option, which gives you the right to sell gold at a pre-determined strike, expiry and amount. Looking at the screenshot you can see that a Put option to sell 10 ounces of gold at strike $1123.57 over the next 7-days would cost you 120.54 USD, which is also your maximum risk. As the price of gold declines below the strike price $1123.57, the option’s value will rise and you may profit. You may also close the position before expiry to lock-in a profit or loss.
The content provided is made available to you by ORE Tech Ltd for educational purposes only, and does not constitute any recommendation and/or proposal regarding the performance and/or avoidance of any transaction (whether financial or not), and does not provide or intend to provide any basis of assumption and/or reliance to any such transaction.
Recommended Content
Editors’ Picks
EUR/USD regains traction, recovers above 1.0700

EUR/USD regained its traction and turned positive on the day above 1.0700 in the American session. The US Dollar struggles to preserve its strength after the data from the US showed that the economy grew at a softer pace than expected in Q1.
GBP/USD returns to 1.2500 area in volatile session

GBP/USD reversed its direction and recovered to 1.2500 after falling to the 1.2450 area earlier in the day. Although markets remain risk-averse, the US Dollar struggles to find demand following the disappointing GDP data.
Gold holds around $2,330 after dismal US data

Gold fell below $2,320 in the early American session as US yields shot higher after the data showed a significant increase in the US GDP price deflator in Q1. With safe-haven flows dominating the markets, however, XAU/USD reversed its direction and rose above $2,340.
XRP extends its decline, crypto experts comment on Ripple stablecoin and benefits for XRP Ledger

Ripple extends decline to $0.52 on Thursday, wipes out weekly gains. Crypto expert asks Ripple CTO how the stablecoin will benefit the XRP Ledger and native token XRP.
After the US close, it’s the Tokyo CPI

After the US close, it’s the Tokyo CPI, a reliable indicator of the national number and then the BoJ policy announcement. Tokyo CPI ex food and energy in Japan was a rise to 2.90% in March from 2.50%.