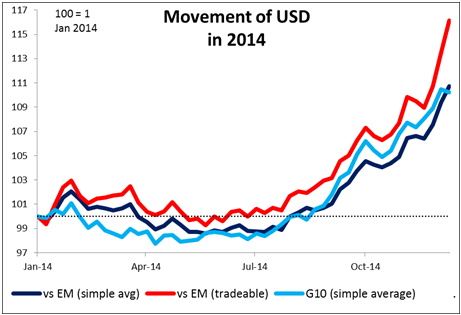
Market gripped by panic Yesterday’s moves clearly smelled of panic in the markets. The nearly 20% drop in the ruble plus the huge moves in NOK (a nearly 7% move in EUR/NOK in two hours that was totally reversed in the next four hours) were not rational. However, the markets calmed down somewhat by the end of the US day and many of the bigger moves were reversed. USD/JPY for example went from a low of 115.57 to end the US day around 117.30, barely changed from where it had opened in Europe that morning. In such conditions, fundamentals go out the window and it all becomes a matter of market sentiment. The Russian central bank governor has ruled out capital controls, but that would seem to be the only way to keep the currency from depreciating further.
The dollar’s continued gains against the EM currencies spells trouble for the world economy. It’s been widely discussed how companies in many EM countries have raised money through dollar-denominated bonds in recent years. Every time the dollar moves up, their interest costs increase. This is likely to be a growing strain in many countries.
Oil fell further yesterday as the market continues to ignore all the bullish news and focus simply on the larger, longer-term supply/demand picture. Problems facing the market include: production in the US state of North Dakota has decreased, the number of idle oil rigs is increasing, Libya stopped loading crude at two ports due to fighting, and oil workers are striking in Nigeria. Eventually the panic should subside and we should start to see oil stabilize, which might bring some needed respite to other markets. However the technical show continued strong downward momentum (see below) and so I don’t look for this to happen today.
In the US, housing starts and building permits fell in November but the strong revision of the previous figures kept the overall trend consistent with an improving housing market. This signals that the housing market is supporting what appears to be growing strength in the broader economy. However, with all the excitement elsewhere in the world, economic news like this is not that relevant.
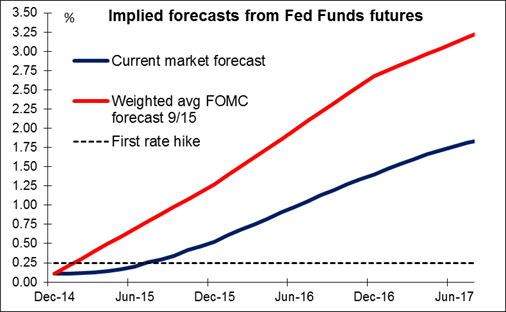
Today: FOMC meeting The highlight today will be the FOMC meeting. After the Committee ended its QE3 program at October’s meeting, expectations are now that they will change their stance and drop the “considerable time” phrase from their language, although not all FOMC members agree. If they do drop it, the market will debate the nuance of whatever they replace it with (if anything). (Just for the record, I do expect that they will replace it with a phrase that still indicates a delay before the first hike, but just less of a delay.) The Committee will also give new forecasts for the economy, inflation and interest rates, including the famous “dot plot” of Fed funds rate expectations.
Given the data we’ve had since the previous forecasts, I would expect the new growth forecasts to be revised up and the unemployment and inflation forecasts revised down. Despite the better growth outlook, the interest rate forecasts also may be revised down slightly because of lower inflationary pressures. That could offset some of the bullish implications and be consistent with current expectations of the first rate hike coming around the middle of the year. As a result there might not be that much impact on the markets at the end of the day. Although many investors are wondering if the current turmoil in the financial markets would encourage the Fed to delay rate hikes, officials have always said that they expect some volatility in markets, and the recent gyrations are not (yet) out of the ordinary, at least in the US. We will hear more when Fed Chair Yellen holds a press conference following the decision.
During the European day, Eurozone’s final CPI for November is expected to confirm the preliminary reading.
In the UK, we get the minutes from the latest BoE meeting. Once again the focus will be on the number and the names of the dissenters. At BoE’s November inflation report, Kristin Forbes, who is one of the Monetary Policy Committee's new members, suggested that wages may be starting to pick up and also that slack in the labor market could be lower than has been estimated. These views put her on the “hawkish” end of the scale and we wouldn’t be surprised if she joins the other two MPC members in voting for a rate hike anytime soon.
As for the indicators, the UK unemployment rate is expected to have declined to 5.9% in October from 6.0%, suggesting less slack in the labor market. Average weekly earnings are anticipated to accelerate to 1.2% yoy, adding to the positive employment report. On the other hand, given that the CPI rate for October was 1.3% yoy this could leave real wages unchanged or negative. Labor market data remain crucial since if wage growth remains muted then the market is likely to remain convinced that the first rate hike won’t come before the general election in May.
The US CPI and trade data are also to be released. The CPI will be of less interest than usual as it coincides with the FOMC meeting.
In the political sphere, the Greek parliament will vote for a new President for the country. It’s pretty certain that the government’s candidate will fail to get enough votes, which means another vote in five days. It’s likely that he will fail to get enough votes then too, necessitating a final vote on Dec. 29th. That’s the key date for Greece and the Eurozone.
The Market
EUR/USD above the 200-period moving average
EUR/USD firmed up on Tuesday and broke above the 200-period moving average. However, the pair declined somewhat after finding resistance at the 1.2570 (R2) line and during early European hours it is heading for a test of the aforementioned moving average as a support this time. I would expect for the pair to move a bit higher again given the positive sentiment towards EUR from yesterday’s surprisingly strong ZEW figures, at least until the FOMC decision and Fed Chair Janet Yellen’s press conference. In the bigger picture, the rate is still printing lower peaks and lower troughs below both the 50- and the 200-day moving averages and this keeps the overall path to the downside.
Support: 1.2410 (S1), 1.2360 (S2), 1.2300 (S3).
Resistance: 1.2530 (R1), 1.2570 (R2), 1.2620 (R3).
USD/JPY test the 117.35 as a resistance
USD/JPY declined on Tuesday and broke below the support-turned-into-resistance hurdle of 117.35 (R1). The move was stopped few pips above our 115.45 (S1) support line, which happens to be the 38.2% retracement level of the 15th October - 8th December advance. During the early European hours, the pair is testing the 117.35 (R1) resistance level. Looking at our short-term momentum signals, the RSI found support just below the 30 line and moved up, while the MACD shows signs of bottoming and seems ready to cross above its trigger line. These momentum signs point to a halt in the decline, at least temporarily. As for the broader trend, the price structure is still higher highs and higher lows above both the 50- and the 200-day moving averages and this keeps the overall path of the pair to the upside. Therefore, I still consider the recent setback or any extensions of it as a correction of the longer-term uptrend.
Support: 115.45 (S1), 114.00 (S2), 113.400 (S3).
Resistance: 117.35 (R1), 120.00 (R2), 121.85 (R3).
GBP/USD break two resistance in a row
GBP/USD advanced sharply on Tuesday, breaking two resistance levels in a row. The move was halted by the 200-period moving average pushing the rate below 1.5740 (R1) again. While the GBP/USD gyrations around 1.5700 may continue as the pair is in a consolidative mode since early November, the price is more likely to trend down than up. I would wait for Fed Chair Janet Yellen and the new forecasts for the economy including the “dot plot” of Fed funds rate expectations to print a better technical picture. On the daily chart, I maintain the view that the overall path is to the downside and I would treat any upside correction waves that stay limited below the 80-day exponential moving average as renewed selling opportunities.
Support: 1.5655 (S1), 1.5600 (S2), 1.5550 (S3).
Resistance: 1.5740 (R1), 1.5800 (R2), 1.5840 (R3) .
WTI below 55.00
WTI seems to be on a freefall as it breaks below the support-turned-into-resistance 55.00 (R1) level. The dip was stopped at 53.80 (S1) support line, defined by the lows of 30th January 2007. A break below that line could push the price even lower, perhaps towards our next support of 52.60 (S2). On the daily chart, the bigger picture remains to the downside and our daily technical studies support this notion. Both the 50- and the 200-day moving averages remain above the price structure and their slope stays to the downside. The 14-day RSI remains within its oversold territory pointing sideways, while the daily MACD, already at extreme low levels, stands below its trigger line pointing down. These momentum signals designate strong downside momentum and amplify the case that we are likely to see even lower oil prices in the near future.
Support: 53.80 (S1), 52.60 (S2), 50.35 (S3).
Resistance: 55.00 (R1), 56.25 (R2), 58.60 (R3).
Gold just above 1190 again
Gold jumped on Tuesday and broke two resistance in a row but dipped afterwards, breaking through our 1190 (S1) support line, only to end the day back at its previous day’s level. Looking at our short-term momentum signals, the RSI found support again near its 30 line and is pointing up, while the MACD although in its negative territory seems willing to cross its trigger line any time soon. Another test of the 1210 (R1) resistance hurdle seems possible, as the bears seem unable to push the price lower. Nevertheless, I would wait for the FOMC decision later in the day to help see a better technical picture.
Support: 1190 (S1), 1186 (S2), 1175 (S3).
Resistance: 1210 (R1), 1215 (R2), 1235 (R3).
BENCHMARK CURRENCY RATES - DAILY GAINERS AND LOSERS
MARKETS SUMMARY
Recommended Content
Editors’ Picks
EUR/USD stays below 1.0700 after US data

EUR/USD stays in a consolidation phase below 1.0700 in the early American session on Wednesday. The data from the US showed a strong increase in Durable Goods Orders, supporting the USD and making it difficult for the pair to gain traction.
USD/JPY refreshes 34-year high, attacks 155.00 as intervention risks loom

USD/JPY is renewing a multi-decade high, closing in on 155.00. Traders turn cautious on heightened risks of Japan's FX intervention. Broad US Dollar rebound aids the upside in the major. US Durable Goods data are next on tap.
Gold trades on the back foot, manages to hold above $2,300

Gold struggles to stage a rebound midweek following Monday's sharp decline but manages to hold above $2,300. The benchmark 10-year US Treasury bond yield stays in the green above 4.6% after US data, not allowing the pair to reverse its direction.
Worldcoin looks set for comeback despite Nvidia’s 22% crash Premium

Worldcoin price is in a better position than last week's and shows signs of a potential comeback. This development occurs amid the sharp decline in the valuation of the popular GPU manufacturer Nvidia.
Three fundamentals for the week: US GDP, BoJ and the Fed's favorite inflation gauge stand out Premium

While it is hard to predict when geopolitical news erupts, the level of tension is lower – allowing for key data to have its say. This week's US figures are set to shape the Federal Reserve's decision next week – and the Bank of Japan may struggle to halt the Yen's deterioration.

