A currency isn’t the stock price of a country... The third revision to the US GDP figures were shocking. GDP was revised down from -1.0% qoq SAAR to -2.9%. There has been only one previous quarter in the post-WWII era when output fell by a similar amount and the economy was not in recession (Q2 1981, -2.9%). Most of the downward revision was because the agency compiling the data used a different source for the data on healthcare spending in this revision, and that other source showed healthcare spending to be much lower. However it’s likely that this is just a question of the timing of payments. If anything, healthcare spending is now likely to be higher because of President Obama’s recent reforms to the US insurance system, which gave health insurance to several million previously uninsured people. The market therefore expects a big bounce back in GDP in Q2. The consensus forecast for Q2 is +3.5% qoq SAAR, according to Bloomberg, and that’s all from forecasts made before the final figure for Q1 was released. Now forecasts are probably north of 4%. Still, the shock lingered. The long end of the Fed Funds futures showed rate expectations down 4 bps, while 10-year yields declined 2 bps on the day.
The shock of the GDP revision was amplified by a lower-than-expected headline figure on US Durable Goods for May, but this was largely attributable to aircraft. The key core durables figure (non-defense capital goods excluding aircraft) was up 0.7% mom vs -1.1% mom in April. This number feeds into the capital spending category in the GDP accounts and so will be another thing boosting Q2 GDP, if it continues. A higher-than-expected Markit service sector PMI for June also helped to calm investors.
It’s noticeable that although interest rates are lower and the dollar is lower almost across the board, stocks in the US closed higher and Asian stock markets are largely higher this morning as well. It appears either that stocks are looking forward to the rebound in growth, or they are more concerned about Fed policy than economics. In the current economic situation, where central banks in effect control the markets, it’s official policy that determines market direction. In that context, bad can be good, if bad means rates will be lower for longer.
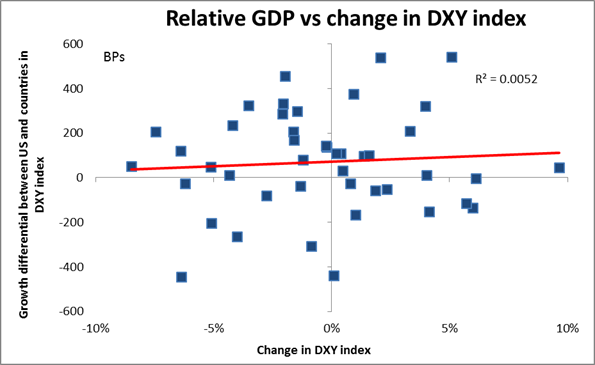
In any event, GDP growth is not that important for the direction of the dollar. Our research has found precious little connection between US growth and the performance of the dollar. In fact, if anything it seems that the dollar tends to decline against the euro when US growth is higher than Eurozone growth! That may seem counter-intuitive, but countries aren’t companies and a currency isn’t the stock price of a country. Stronger growth can mean a country spends more and the current account deteriorates (as is happening with Britain right now), while weak growth can mean a county’s imports fall and the current account improves (see the Eurozone peripheral countries). Right now interest rate differentials, particularly real interest rate differentials, are the major source of direction in the FX market. (Note that the only G10 currencies to fall against USD overnight were NOK and SEK, two currencies where the central banks have been revising down their expected rate paths.) It seems pretty clear that the US is likely to begin tightening policy far earlier than the Eurozone is and so I would expect the dollar to recover from this decline in the near future.
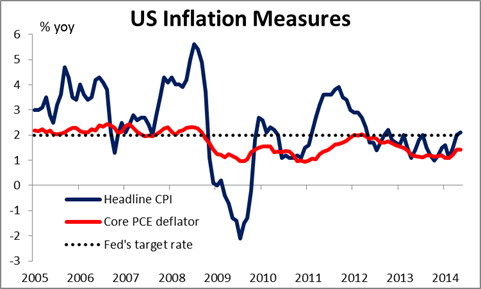
In that respect, today’s US personal consumption expenditure (PCE) deflator may be even more important than the GDP figure. The core PCE (PCE excluding energy and food) is forecast to have risen to 1.6% yoy from 1.4% yoy. This is the inflation measure that the Fed targets. In her recent statement, Fed Chair Janet Yellen dismissed the rise in consumer price inflation in the US to 2.1% yoy in May as “noise,” but if the core PCE deflator starts to get close to the Fed’s 2% target, speculation about an earlier hike in rates at the Fed is bound to heat up and the dollar could appreciate as a result. Along with the PCE deflator, personal income and personal spending for May are expected to have accelerated, which could also help to dispel the GDP gloom. Weekly initial jobless claims are forecast to decline, nonetheless, the 4wk moving average is estimated to remain unchanged.
During the European day Thursday, we have June’s consumer confidence index from France, which is expected to have remained unchanged. Sweden’s May PPI is coming out, but no forecast is available. In Norway, the AKU unemployment rate for April is forecast to have risen slightly.
We have three speakers on Thursday’s agenda. BOE Governor Mark Carney speaks in London on the Financial Stability report, and two Fed Presidents - Richmond’s Jeffrey Lacker and James Bullard of St. Louis - also speak.
THE MARKET
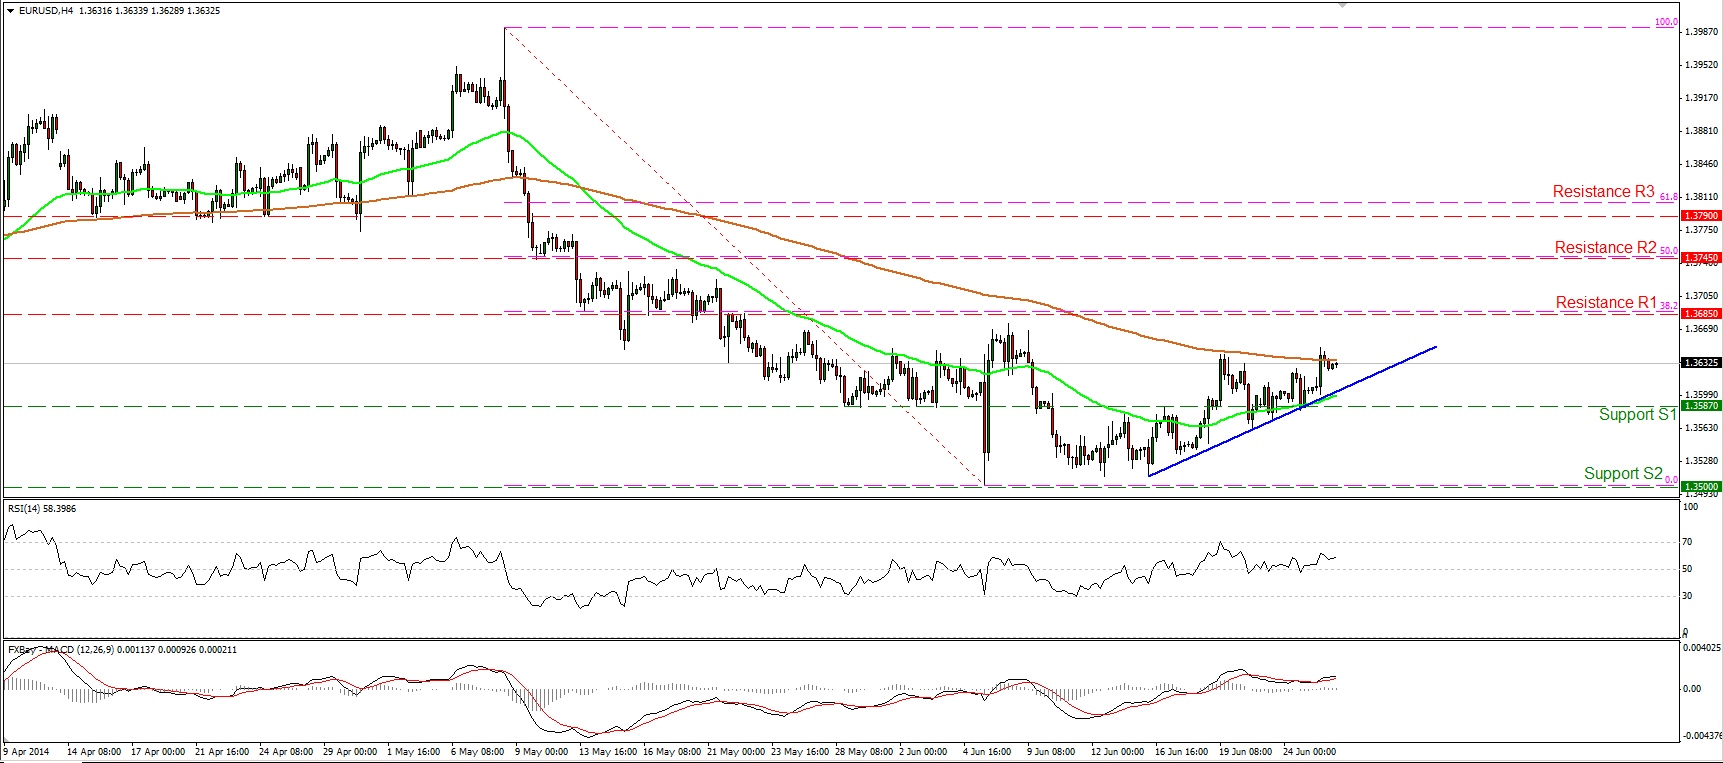
EUR/USD slightly higher
EUR/USD moved slightly higher on Wednesday, reaching again the 200-period moving average. If the bulls are willing to drive the battle above the moving average, I would expect them to target the resistance of 1.3685 (R1), which coincides with the 38.2% retracement level of the 8th May - 5th June decline. The RSI started moving higher after finding support at its 50 level, while the MACD, already in its bullish territory crossed above its signal line, increasing the possibilities for more upside. However, it’s too early to argue for a trend reversal and as a result I would consider the recent advance as a correcting phase, at least for now.
Support: 1.3587 (S1), 1.3500 (S2), 1.3475 (S3).
Resistance: 1.3685 (R1), 1.3745 (R2), 1.3790 (R3).
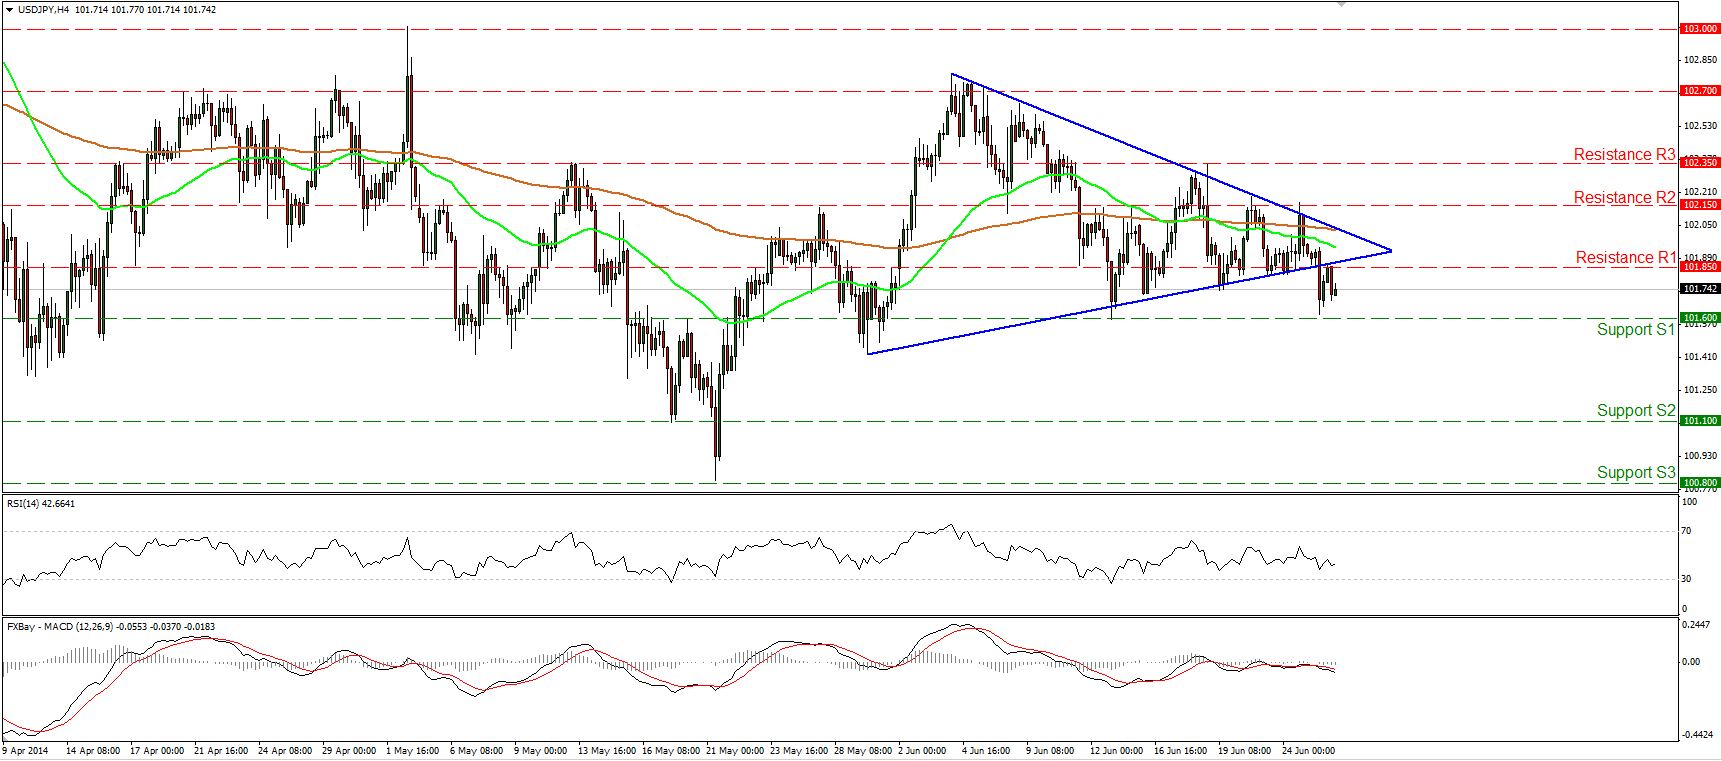
USD/JPY breaks below the triangle
USD/JPY fell below the lower boundary of the symmetrical triangle but the decline was halted near the 101.60 (S1) zone. As long as the rate remains below the bound of the triangle, I see a mildly bearish picture. A decisive dip below the support of 101.60 (S1) may carry larger bearish implications and pave the way towards the next support hurdle of 101.10 (S2). The MACD left its neutral level and moved lower, crossing below its signal line and amplifying the case for further declines. In the bigger picture, the long-term path of USD/JPY remains to the sideways since we cannot identify a clear trending structure.
Support: 101.60 (S1), 101.10 (S2), 100.80 (S3).
Resistance: 101.85 (R1), 102.15 (R2), 102.35 (R3).
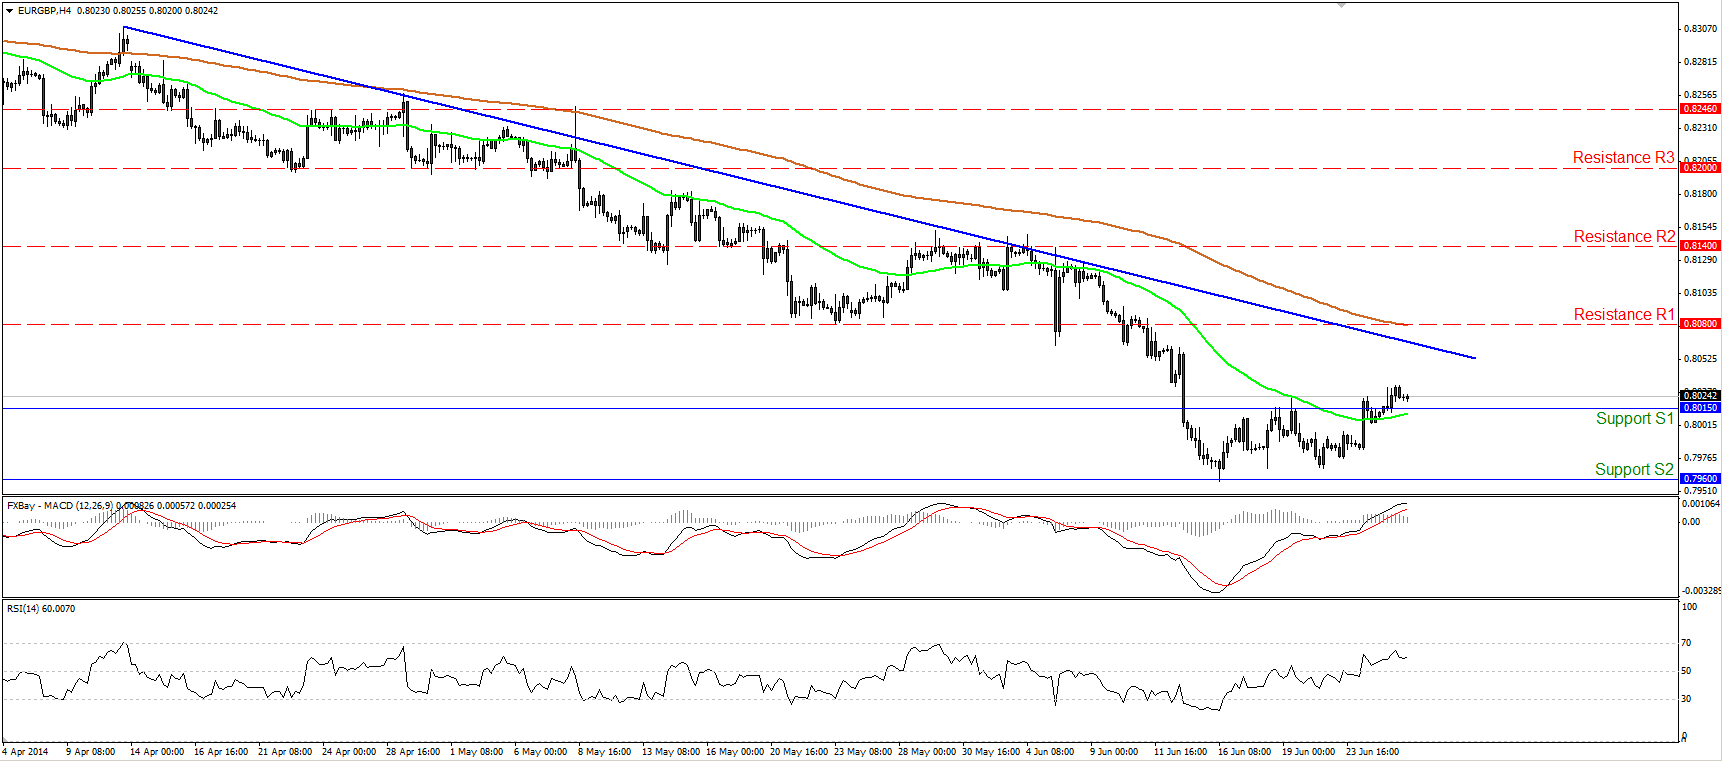
EUR/GBP breaks above 0.8015
EUR/GBP edged above 0.8015, the upper bound of the range that it’s been trading within since the 12th of June. The MACD, already above its trigger line, obtained a positive sign. Given that, I cannot rule out further upside near the blue downtrend line or near the hurdle of 0.8080 (R1), which coincides with the 200-period moving average. Nonetheless, the pair is trading below the blue downtrend line drawn from back the 11th of April, thus I would consider any further upsides as a retracing wave before the bears prevail again. A dip below the 0.7960 (S2) is needed to confirm a forthcoming lower low and trigger thecontinuation of the downtrend.
Support: 0.8015 (S1), 0.7960 (S2), 0.7900 (S3).
Resistance: 0.8080 (R1), 0.8140 (R2), 0.8200 (R3).
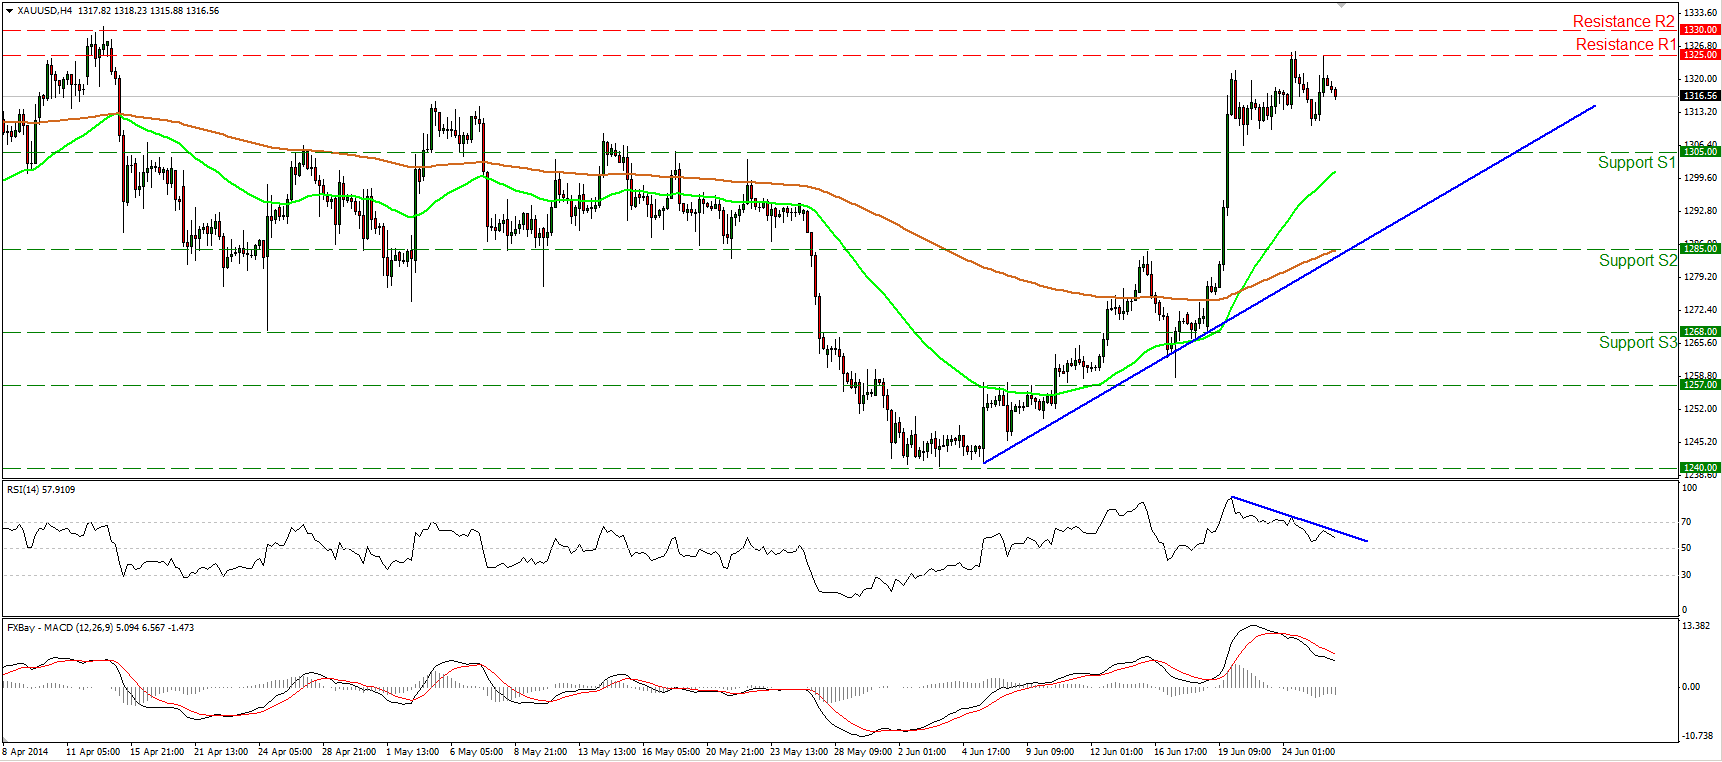
Gold hits 1325 again
Gold tried to edge higher again on Wednesday, but it was stopped once more by the 1325 (R1) resistance bar. The RSI moved lower after exiting overbought conditions, while the MACD remains below its signal line, pointing down. Moreover, on the daily chart, we can identify a shooting star and a spinning top candlesticks, increasing the likelihood for a pullback. However, as long as the precious metal is trading above both the moving averages and above the blue uptrend line, the technical picture remains positive, in my view, and I would consider any further declines as a retracement, at least for now.
Support: 1305 (S1), 1285 (S2), 1268 (S3).
Resistance: 1325 (R1), 1330 (R2), 1342 (R3).
WTI continues between 105.10 and 107.35
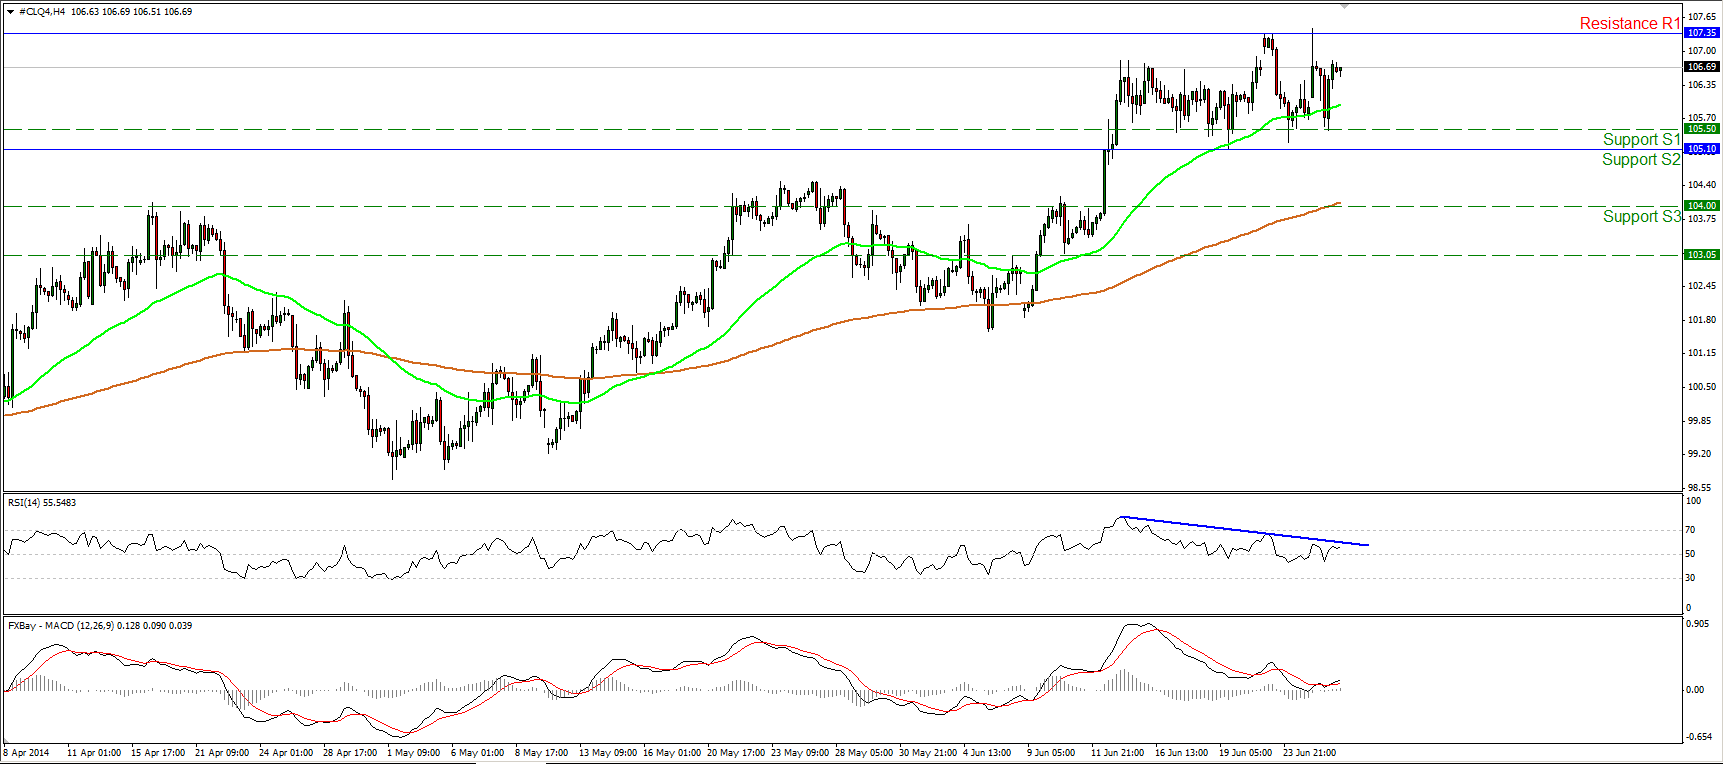
WTI tumbled after hitting the resistance of 107.35 (R1), but rebounded from 105.50 (S1) to trade where we left it yesterday. Considering that WTI continues oscillating between 105.10 (S2) and 107.35 (R1), I still see a sideways path. The MACD crossed above its signal line, but the RSI remains below its downside sloping resistance line. In light of the mixed signals provided by our momentum studies, I would consider the short-term picture to remain neutral. A decisive exit from the sideways path may provide more clues about the forthcoming directional movement of WTI.
Support: 105.50 (S1), 105.10 (S2), 104.00 (S3).
Resistance: 107.35 (R1), 108.00 (R2), 110.00 (R3).
Recommended Content
Editors’ Picks
EUR/USD hovers around 1.0700 ahead of German IFO survey

EUR/USD is consolidating recovery gains at around 1.0700 in the European morning on Wednesday. The pair stays afloat amid strong Eurozone business activity data against cooling US manufacturing and services sectors. Germany's IFO survey is next in focus.
GBP/USD steadies near 1.2450, awaits mid-tier US data

GBP/USD is keeping its range at around 1.2450 in European trading on Wednesday. A broadly muted US Dollar combined with a risk-on market mood lend support to the pair, as traders await the mid-tier US Durable Goods data for further trading directives.
Gold: Defending $2,318 support is critical for XAU/USD

Gold price is nursing losses while holding above $2,300 early Wednesday, stalling its two-day decline, as traders look forward to the mid-tier US economic data for fresh cues on the US Federal Reserve interest rates outlook.
Crypto community reacts as BRICS considers launching stablecoin for international trade settlement

BRICS is intensifying efforts to reduce its reliance on the US dollar after plans for its stablecoin effort surfaced online on Tuesday.
Three fundamentals for the week: US GDP, BoJ and the Fed's favorite inflation gauge stand out Premium

While it is hard to predict when geopolitical news erupts, the level of tension is lower – allowing for key data to have its say. This week's US figures are set to shape the Federal Reserve's decision next week – and the Bank of Japan may struggle to halt the Yen's deterioration.
