The dollar firmed against most major currencies on Monday after strong U.S. retail sales data emerged. Retail sales rose +1.1% mom in March exceeding expectations for a +0.9% mom gain, while February’s rate was revised up to +0.7% mom from +0.3% mom. Retail sales excluding the volatile items of auto and gasoline rose 1.0% mom beating estimates of +0.4% mom. Strong retail sales and Citigroup’s quarterly earnings release that beat expectations helped Wall Street bounce from a sharp selloff in recent days. Asian shares also edged higher in early trade on Tuesday after Wall Street rebounded on solid data.
The euro remained under pressure following weekend comments from European Central Bank officials, including ECB President Mario Draghi signaling more easing in the Eurozone.
The Australian dollar eased after the Reserve Bank of Australia released the minutes of its April meeting. The Bank reiterated that it sees further signs of low interest rates supporting domestic activity, while it repeated that the exchange rate of AUD is high by historical standards.
Tensions in the Ukraine increased the precious metal's safe-haven appeal. Yesterday Gold remained near three-week highs, but declined after strong economic data from the U.S.
Nickel traded near a 14-month high despite Indonesia's ongoing ore export ban, now in its third month, and prospects of tougher sanctions on Russia.
In Asia on Tuesday crude oil prices eased on profit taking after gains made on geopolitical tension in the Ukraine.
The main economic release during the European day will be the German ZEW survey for April. The current situation index is forecast to rise slightly to 51.5 from 51.3, while the expectations index is forecast to be down to 45.0 from 46.6. Last month, the common currency fell after both indices missed estimates, with the expectation index falling far below its February reading. A further decline in the expectations index may hurt the euro.
In the UK, the nation’s CPI for March is forecast to have slowed to 1.6% yoy from 1.7% yoy, which would be the lowest since October 2009.
In the US, the headline CPI is forecast to have accelerated to 1.4% yoy in March from 1.1% yoy in February, while the core inflation rate (excluding food and energy) is expected to have remained unchanged at 1.6% yoy. After the faster-than-expected rise in the nation’s PPI on Friday, a higher headline figure would confirm the upward pressure on inflation and make the Fed more willing to consider higher rates. The Empire State manufacturing survey for April is forecast to rise to 8.00 from 5.61, while the National Association of Home Builders (NAHB) housing market index for the same month is expected to rise to 50 from 47. Numbers like these would continue the string of good data for the US and perhaps help to change views on when the Fed is likely to tighten.
We have three speakers scheduled on Tuesday. Fed Chair Yellen speaks at the Atlanta Fed Financial Markets Conference. The market will listen closely for any comments on the famous “six months” time frame she introduced after the last FOMC meeting as the “considerable time” for increasing rates after the Fed finishes its bond purchases. We saw that in the Fed minutes they made no reference to that timeframe. Philadelphia Fed President Charles Plosser and Boston Fed President Eric Rosengren will also speak.
THE MARKET
EUR/USD
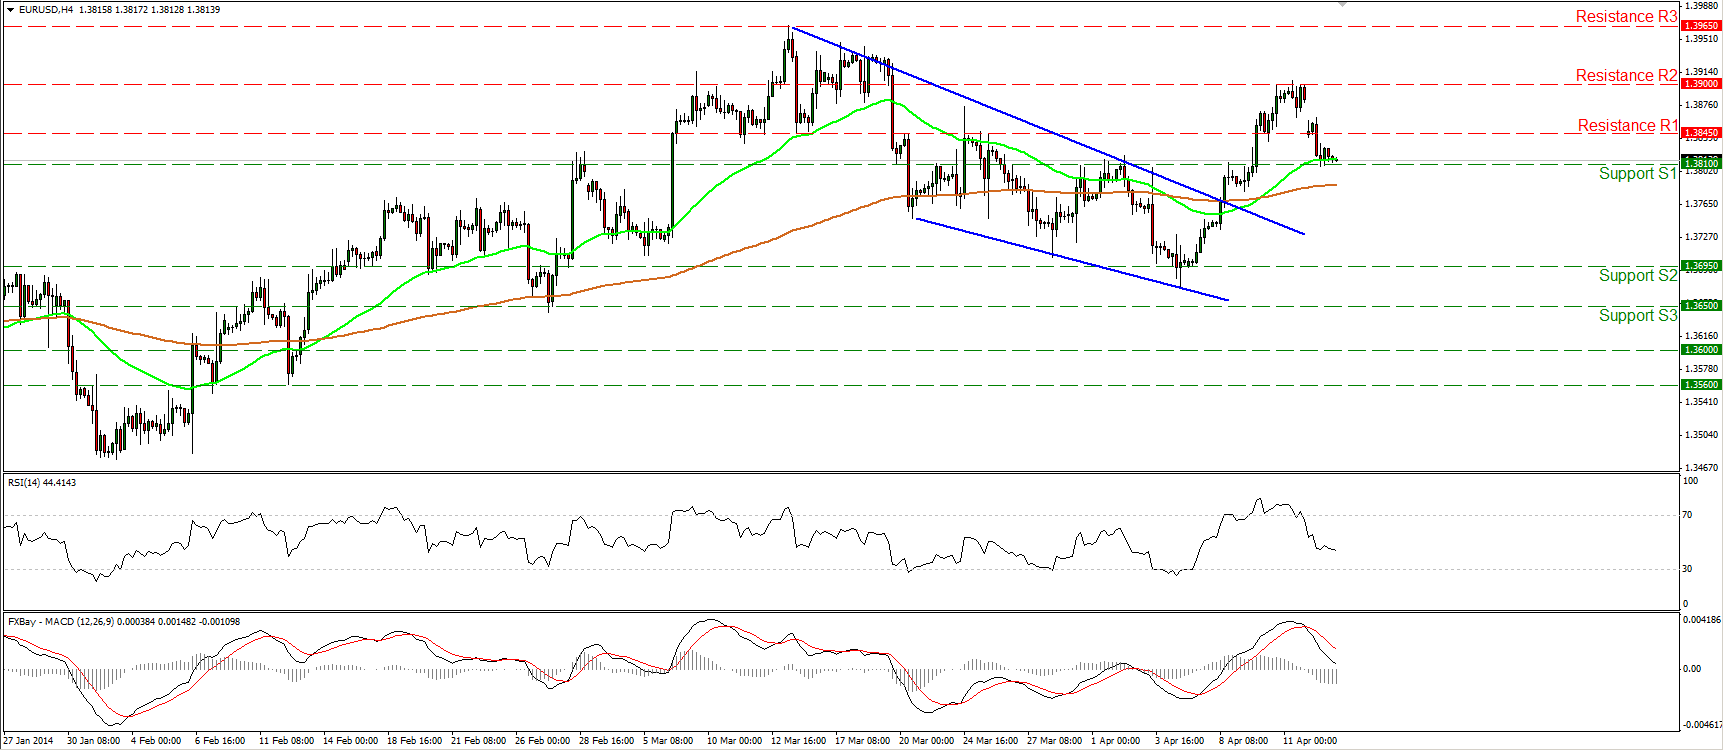
EUR/USD fell below the 1.3845 hurdle but the decline was halted by the 1.3810 (S1) support, near the 38.2% retracement level of the 4th-11th Apr. advance. I would maintain my neutral view since no signs of reversal are provided yet. However, a clear dip below the 1.3810 (S1) may trigger extensions towards the lows of 1.3695 (S2). On the upside, a clear break above the 1.3900 (R2) is needed to signal the continuation of the upside path and may pave the way towards the highs of 1.3965 (R3).
Support: 1.3810 (S1), 1.3695 (S2), 1.3650 (S3).
Resistance: 1.3845 (R1), 1.3900 (R2), 1.3965 (R3).
EUR/JPY
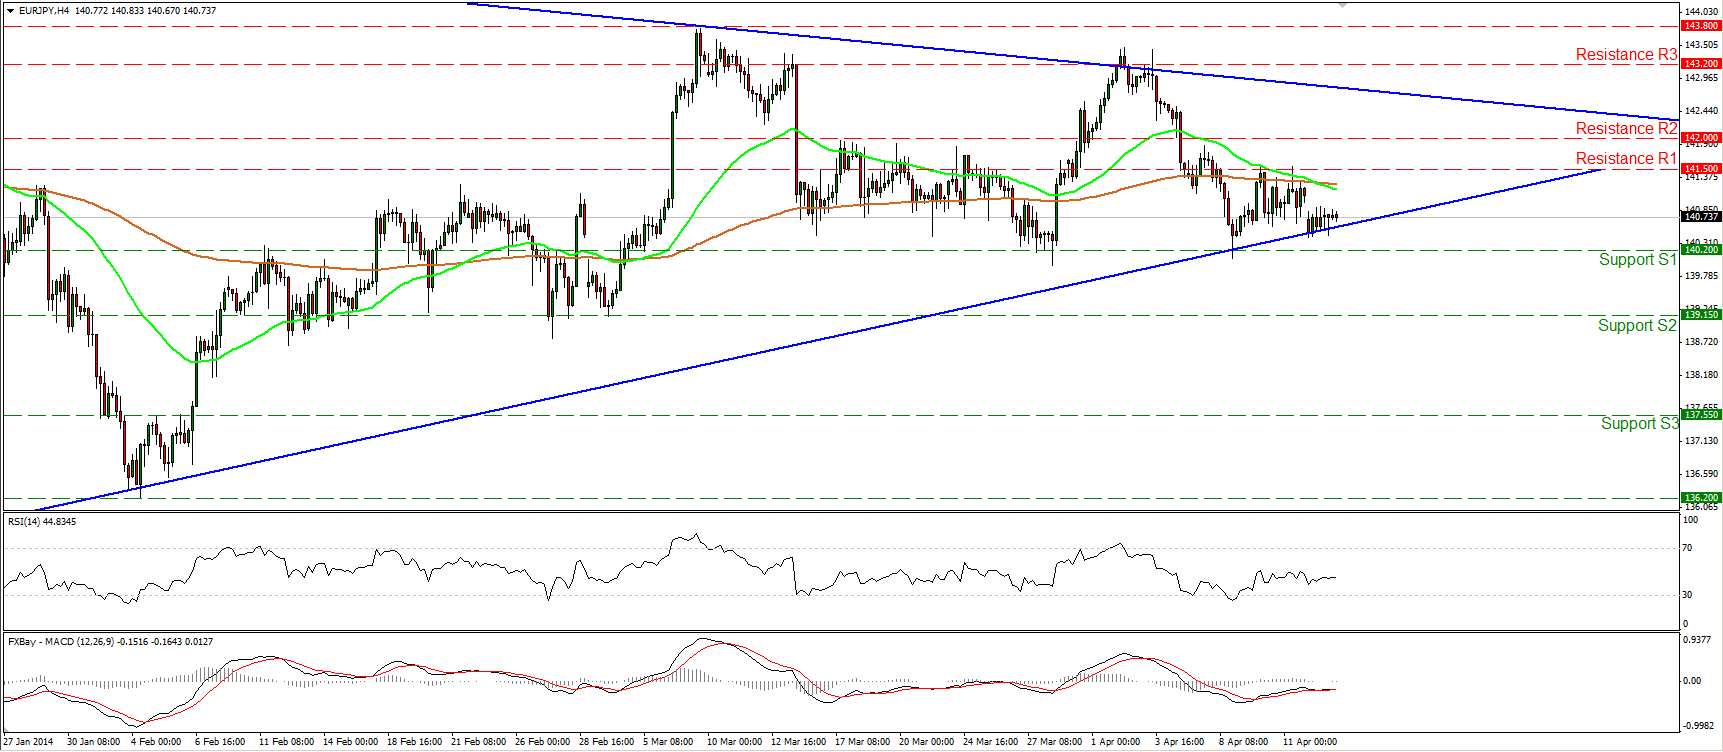
EUR/JPY moved in a consolidative mode, remaining supported by the lower boundary of the triangle formation, identified on the daily chart. The overall picture of the currency pair remains neutral since the rate is not in a clear trending phase and this is also confirmed by the daily MACD and RSI, which lie near their neutral levels. A clear break below the hurdle of 140.20 (S1) may signal the exit from the formation and may have larger bearish implications.
Support: 140.20 (S1), 139.15 (S2), 137.55 (S3).
Resistance: 141.50 (R1), 142.00 (R2), 143.20 (R3).
GBP/USD
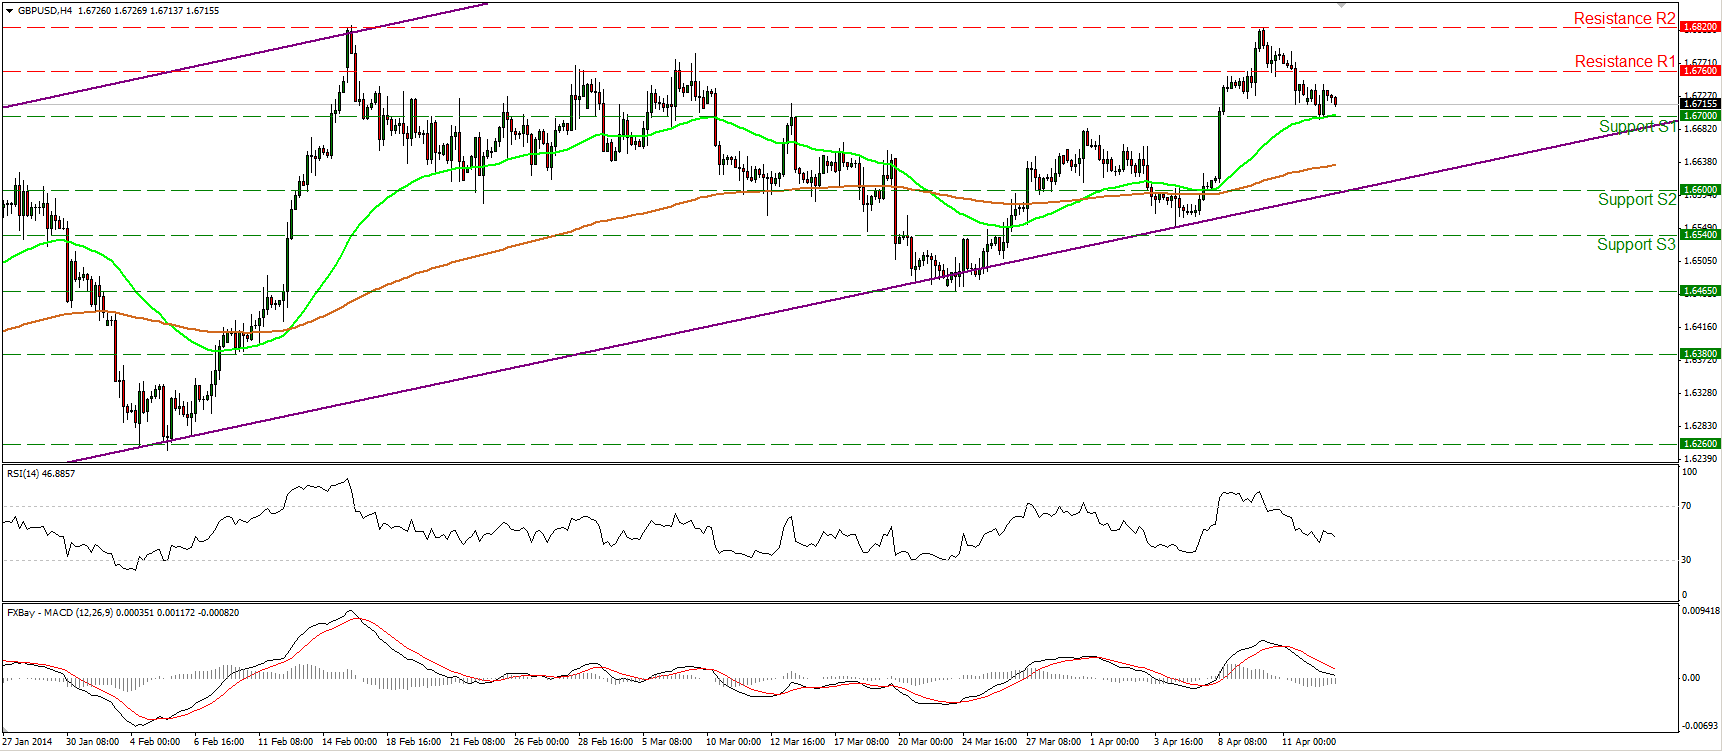
GBP/USD moved slightly lower yesterday to meet support at the 1.6700 (S1), near the 50 period moving average. The rate is trading between that support and the resistance of 1.6700 (R1). Although both our momentum studies follow downward paths, it’s too early to argue for a trend reversal and I would consider any further declines as a corrective phase. On the upside, a break above the highs of 1.6820 (R2) is needed to revive the positive short-term picture. In the bigger picture, cable remains within the upward sloping channel, keeping the long-term outlook to the upside.
Support: 1.6700 (S1), 1.6600 (S2), 1.6540 (S3).
Resistance: 1.6760 (R1), 1.6820 (R2), 1.6885 (R3).
GOLD
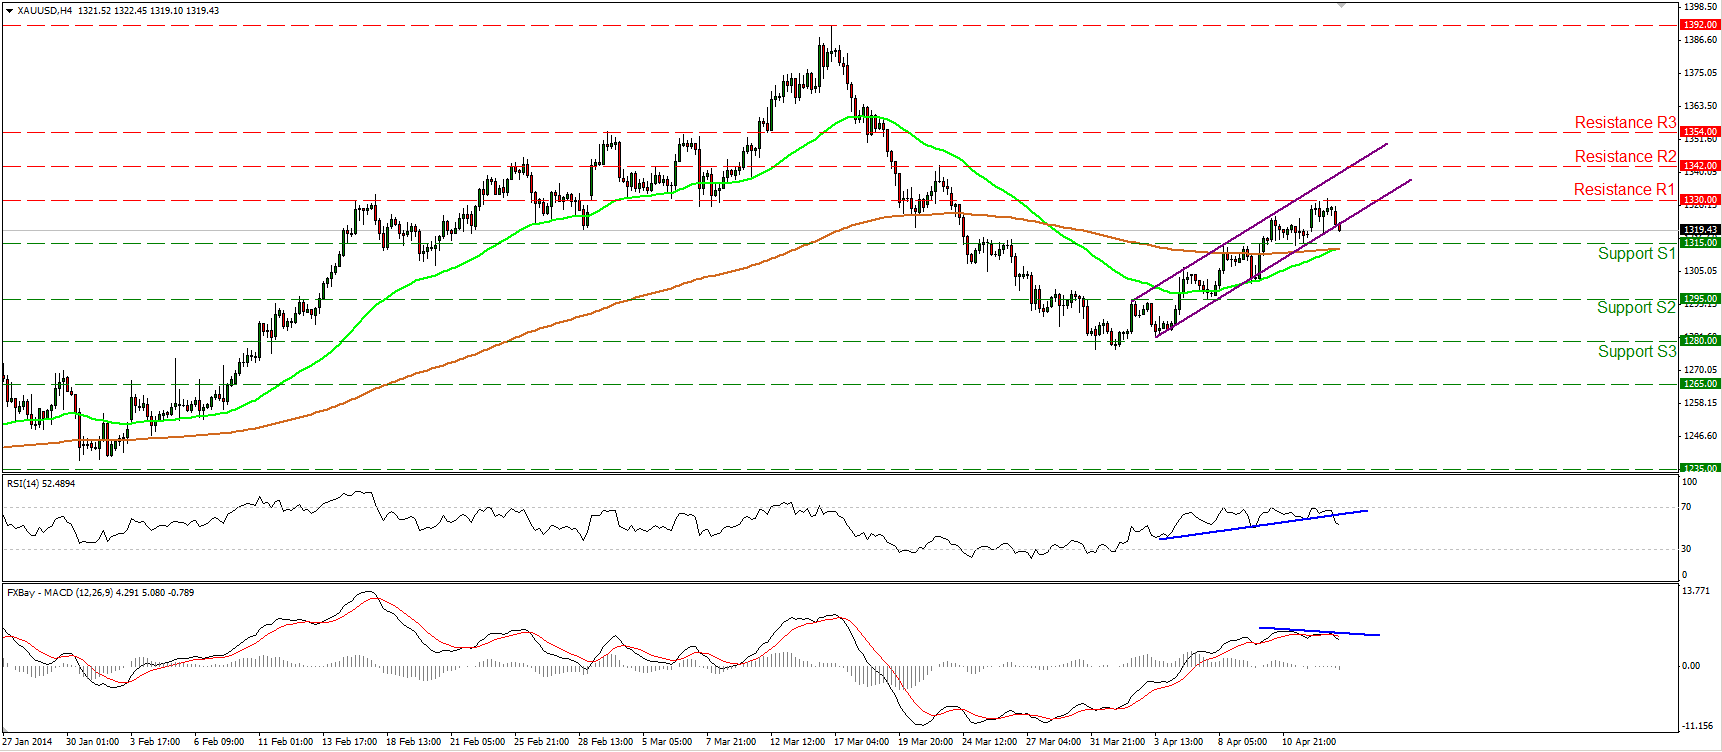
Gold fell below the lower boundary of the upward sloping channel after finding resistance at 1330 (R1). The precious metal is now heading towards the support of 1315 (S1), near both the moving averages. A clear dip below the support zone would confirm a short term lower low and may pave the way towards the next hurdle at 1295 (S2). Negative divergence is identified between the MACD and the price action, while the RSI fell below its blue support line after finding resistance at its 70 barrier, confirming the weakening momentum of the short-term uptrend.
Support: 1315 (S1), 1295 (S2), 1280 (S3).
Resistance: 1330 (R1), 1342 (R2), 1354 (R3).
OIL
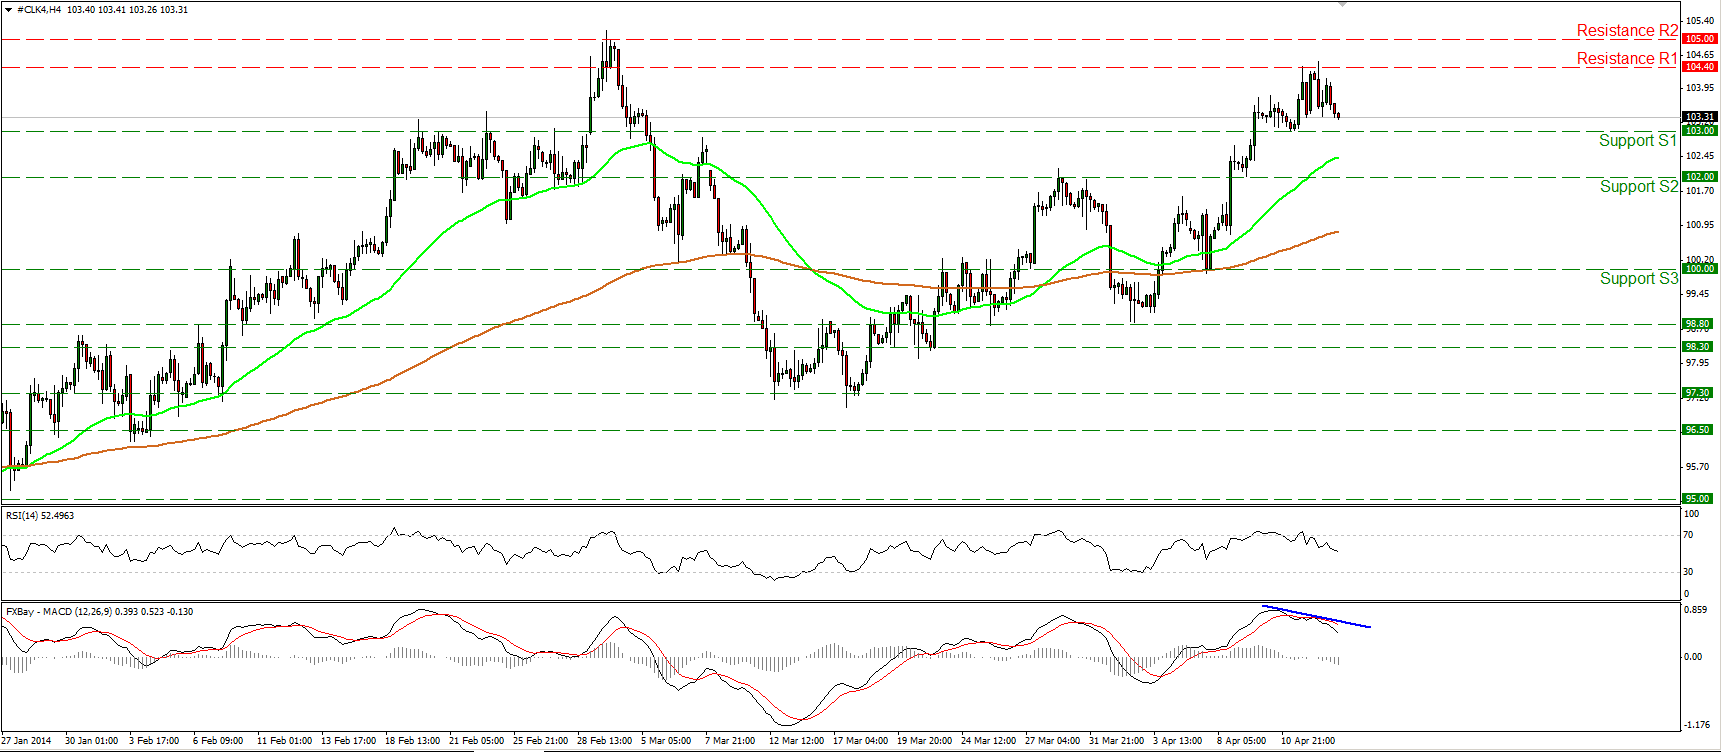
WTI failed to reach the 105.00 (R2) barrier and met resistance at 104.40 (R1). The price is now heading towards the support bar of 103.00 (S1). Considering the negative divergence between the MACD and the price action and the fact that the indicator fell below its signal line, we may experience the continuation of the retracement, perhaps towards the 102.00 (S2) support level. On the daily chart, we can identify a shooting star candle formation, increasing the possibilities for further correction.
Support: 103.00 (S1), 102.00 (S2), 100.00 (S3).
Resistance: 104.40 (R1), 105.00 (R2), 108.00 (R3).
Recommended Content
Editors’ Picks
AUD/USD turns south toward 0.6400 after mixed Australian jobs data

AUD/USD has come under renewed selling pressure and turned south toward 0.6400 after Australian employment data pointed to loosening labor market conditions, fanning RBA rate cut expectations and weighing on the Aussie Dollar.
USD/JPY remains below 154.50 amid weaker US Dollar

USD/JPY keeps losses for the second successive session, trading below 154.50 in Asian trading on Thursday. The pair is undermined by the latest US Dollar pullback, Japan's FX intervention risks and a softer risk tone.
Gold price finds buyers again near $2,355 as USD licks its wounds

Gold price is attempting a tepid bounce in the Asian session, having found fresh demand near $2,355 once again. Gold price capitalizes on a softer risk tone and an extended weakness in the US Treasury bond yields, despite the recent hawkish Fed commentary.
OMNI post nearly 50% loss after airdrop and exchange listing

Omni network lost nearly 50% of its value on Wednesday after investors dumped the token following its listing on top crypto exchanges. A potential reason for the crash may be due to the wider crypto market slump.
US stock continue to stumble as traders rethink rates

US stocks grappled with uncertainty on Wednesday in the wake of a cautious string of commentary from the US Federal Reserve officials. The S&P 500 is currently experiencing its longest non-bullish streak in months.
