Earlier today, theBritish pound extended gains and hit a 4-1/2 year high against the greenback asupbeat U.K. employment data released on Wednesday still weighted on the pair.Thanks to these circumstances, GBP/USD broke above the important resistancezone. Despite this bullish sign, the exchange rate reversed. Will the buyersmanage to close the day above the previous 2014 high?
In our opinion, thefollowing forex trading positions are justified - summary:
- EUR/USD: none
- GBP/USD: short (stop-loss order: 1.6855)
- USD/JPY: none
- USD/CAD: none
- USD/CHF: none
- AUD/USD: none
EUR/USD
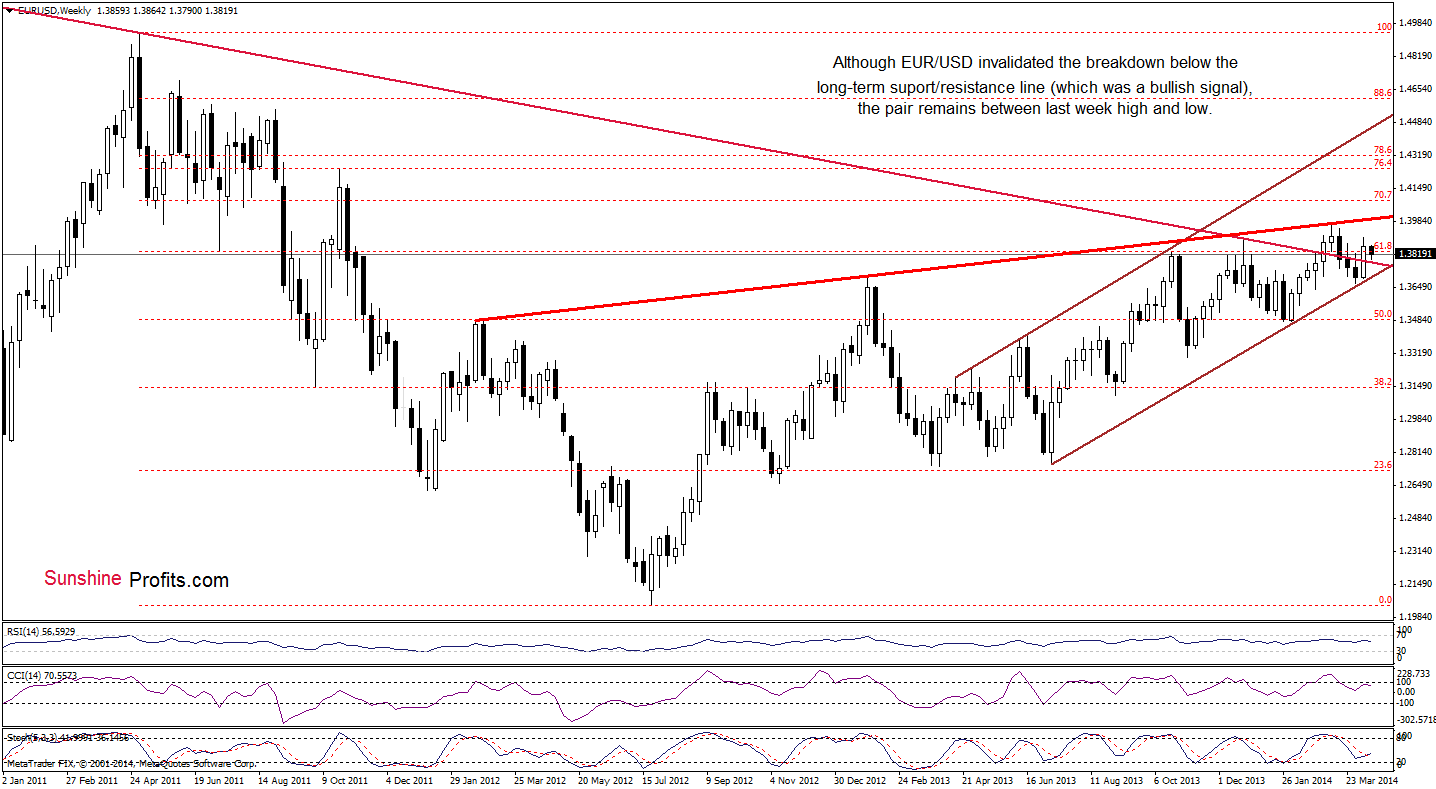
From the weekly perspective, we see that the situationhasn’t changed much. Therefore, what we wrote in our previous Forex TradingAlert is still up-to-date.
(…) EUR/USDstill remains above the previously-broken long-term declining resistance lineand the lower border of the rising trend channel (marked with brown). (…)
Thesetwo important lines still serve as major support. As you see on the abovechart, the exchnge rate remains below the 2014 high and the rising resistanceline (marked with red), which succesfully stopped growth in the previous month.From this perspective, it seems that as long as these key lines are in play, abigger upward or downward move is not likely to be seen.
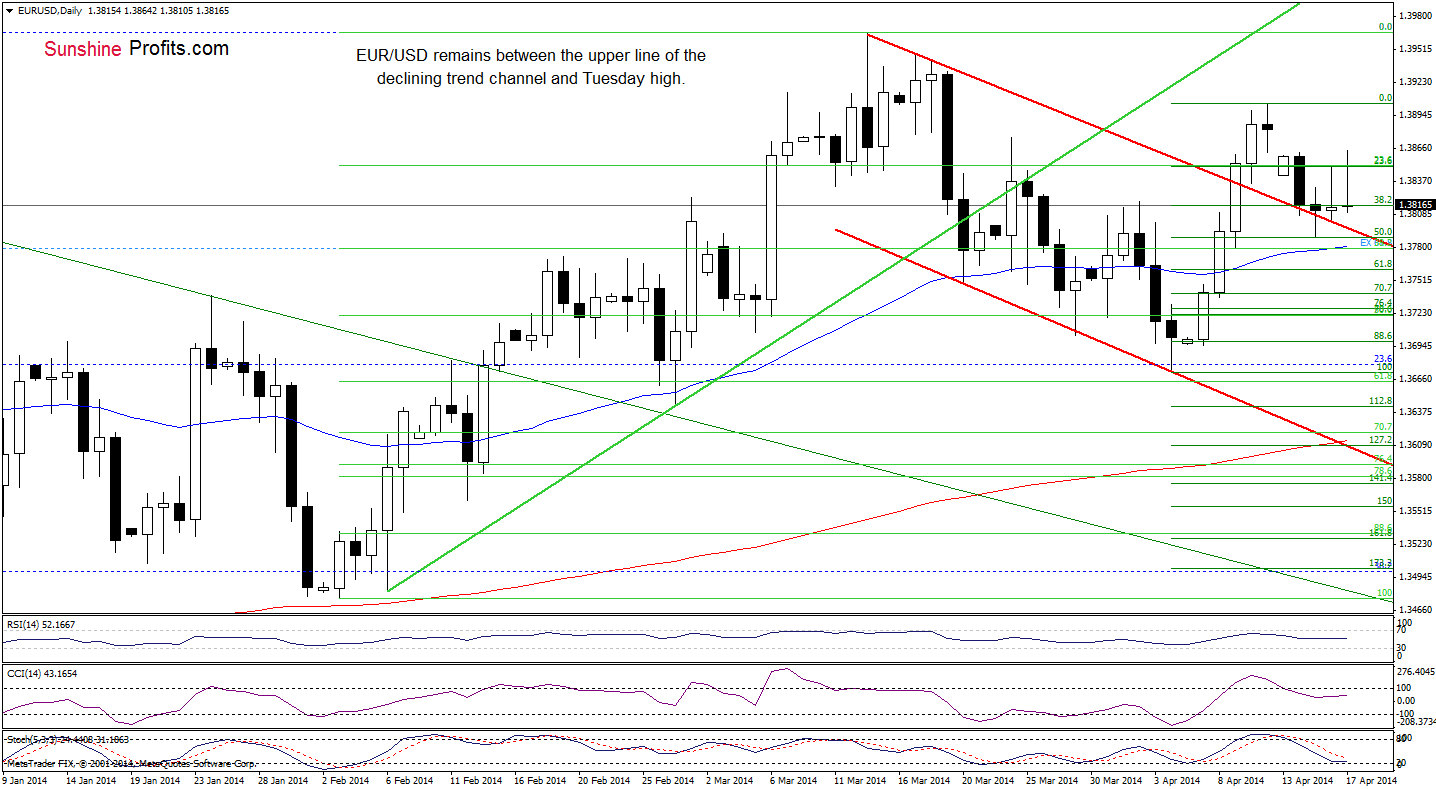
Once we know the above, let’s take a look at the dailychart.
Quoting our previousForex Trading Alert:
(…) the exchange rate rebounded and erased 50%of the recent decline. If the buyers do not give up, we may see furtherimprovement and an increase to Monday high of 1.3862.
Looking at the abovechart, we see that the buyers realized this bullish scenario earlier today.Despite this improvement, they didn’t managed to hold gained levels and theexchange rate declined (which is not a positive signal). As you see on theabove chart, with this downswing, the pair dropped to around yesterday’sclosing price. Taking into account the position of the indicators (sell signalsremain in place) we see that they still favor sellers, which suggests thatanother attempt to break below the upper line of the declining trend channelshould not surprise. If this is the case, the first downside target will be the50-day moving average (currently at 1.3780). If it is broken, we will likelysee a drop to around 1.3777, where the long-term declining line is.
Very short-termoutlook: bearish
Short-term outlook:bearish
MT outlook: bearish
LT outlook: bearish
Trading position: In our opinion no positions are justified fromthe risk/reward perspective. We are not opening short positions just yet,because of the divergence on the long-term charts (we wrote more about thissituation in our Forex Trading Alert posted on Thursday), however we will quitelikely open it once we see some kind of confirmation.
GBP/USD
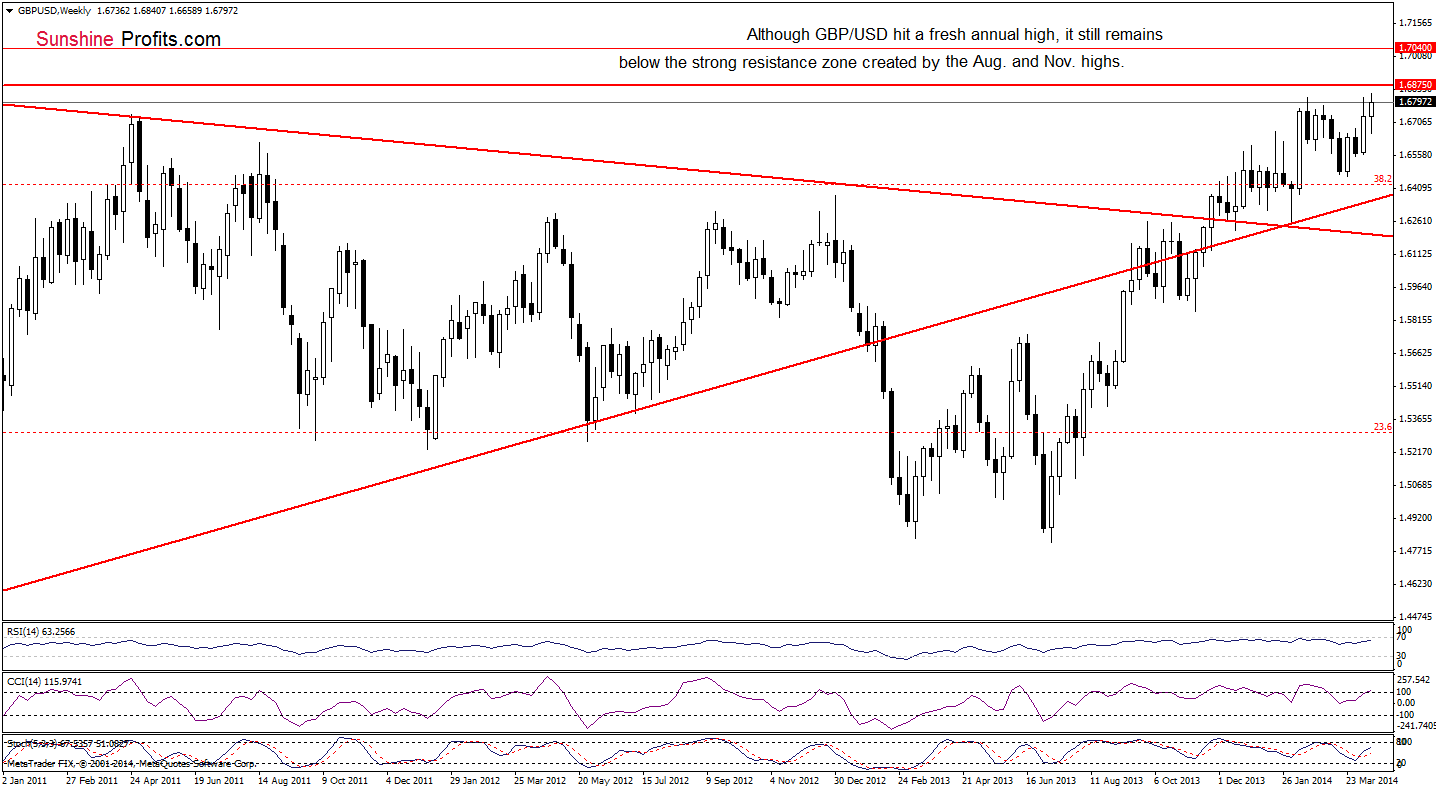
From the weeklyperspective, we see that GBP/USD climbed higher and hit a fresh 2014 high.Despite this bullish sign, the exchange rate still remains below the strongresistance zone created by Aug. and Nov. 2009 highs, which may pause or evenstop further improvement.
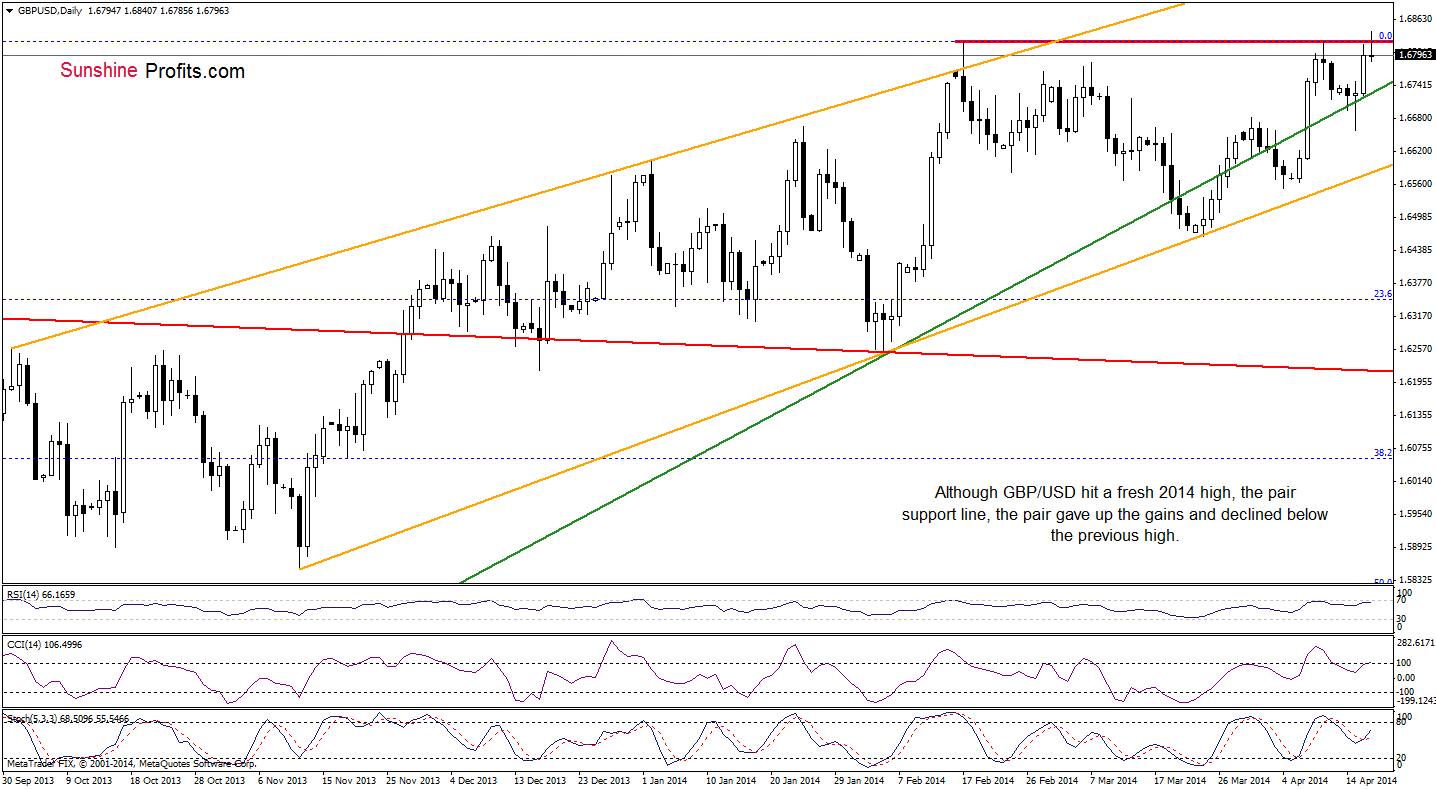
To have morecomplete picture of the currentsituation in GBP/USD, let’s take a look at the daily chart.
On the above chart, we see that GBP/USD extended gains and broke above theresistance zone created by April and 2014 highs. However, as it turned out inthe following hours, the pair reversed and slipped below the previous highs,invalidating earlier breakout. An invalidation of a breakout is a bearishsignal, which might trigger a bigger decline. If this is the case, the initialdownside target for the sellers will be the previously-broken green medium-termsupport line (currently around 1.6727).
Very short-termoutlook: bearish
Short-term outlook: mixedwith bearish bias
MT outlook: bearish
LT outlook: mixed
Trading position(short-term; our opinion): Short. Stop-loss order: 1.6855. Please note that ifthe pair moves above our stop-loss level, it seems that it will rally some morebefore heading south once again. If this is the case, we’ll consider re-opening short positions around the 2009 high.
USD/JPY
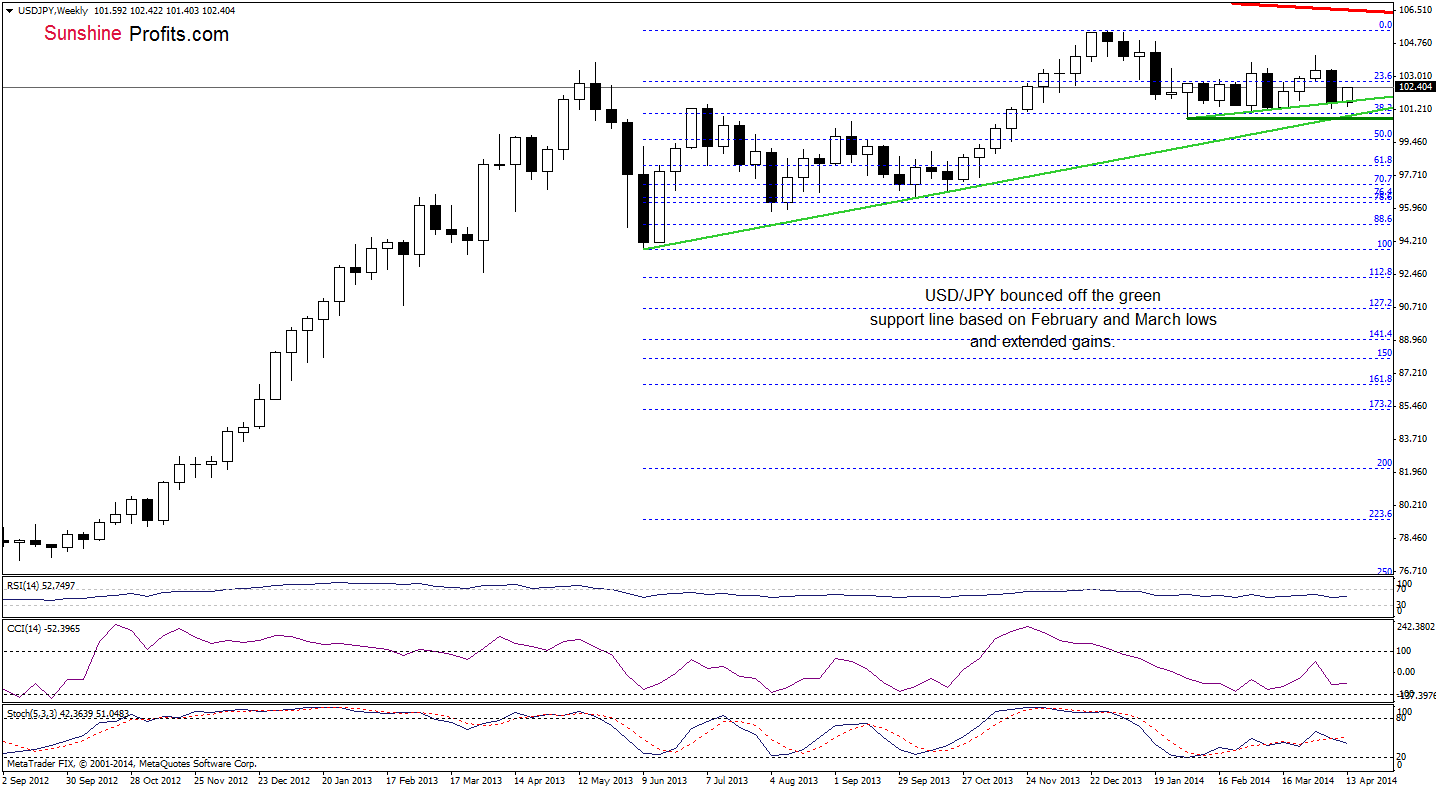
From the weeklyperspective, we see that the situation has improved slightly as USD/JPYextended gains. Similarly to what we wrote yesterday, if the buyers do notfail, we will likely see further improvement. Where the exchange rate couldclimb in the coming days? Let’s take a look at the daily chart.
Quoting our previousForex Trading Alert:
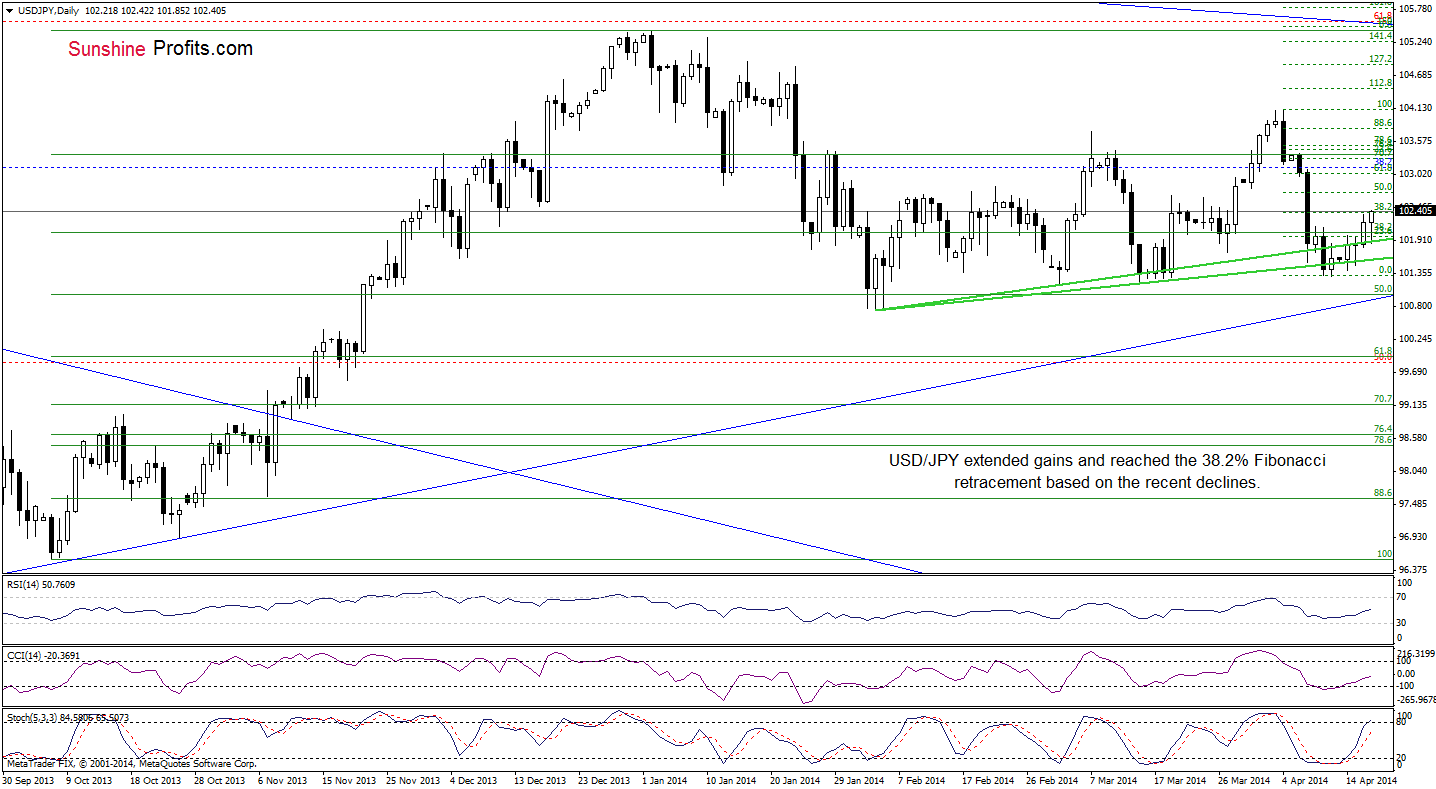
(…) the buyers finally managed to push USD/JPYabove this resistance, which is a bullish signal. Taking into account the factthat buy signals generated by the indicators remain in place, we may seefurther improvement. In this case, the initial upside target will be around102.70, where the 50% Fibonacci retracement based on the recent decline is. Ifit is broken, the next target for the buyers will be slightly below the April 8high - around 103.03 (the 61.8% retracement).
As you see on theabove chart, the pair extended gains and climbed not only above Wednesday high,but also above the 38.2% Fibonacci retracement, which is a bullish signal.Taking this fact into account and combining with the position of theindicators, it seems that the initial upside target from our last Forex TradingAlert may be reached in the coming day (or days).
Very short-termoutlook: bullish
Short-term outlook:mixed with bullish bias
MT outlook: bullish
LT outlook: bearish
Trading position(short-term): In our opinion no positions are justified from the risk/rewardperspective at the moment.
USD/CAD
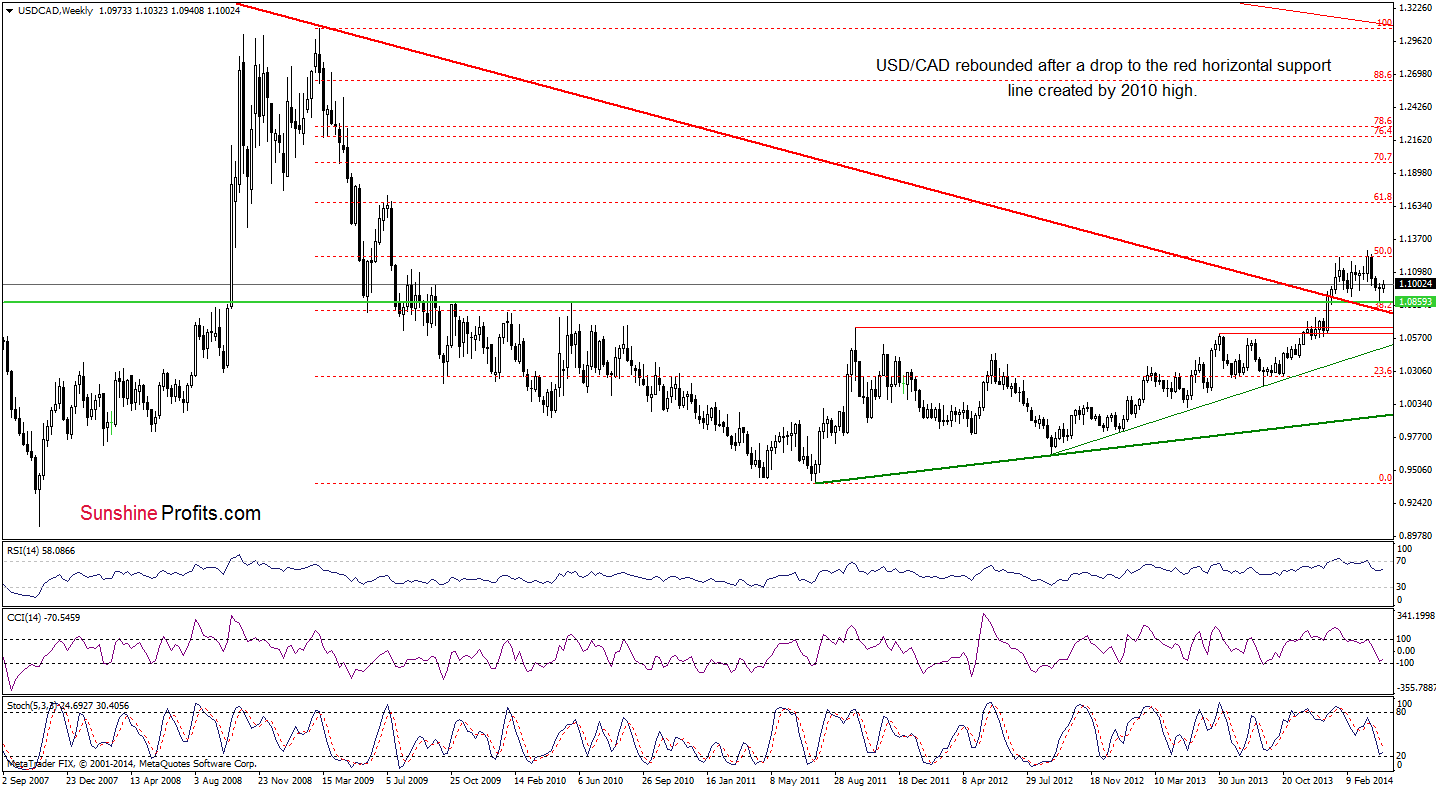
Looking at USD/CADfrom the weekly perspective, we see that the situation hasn’t changed. So, whatwe wrote yesterday is still valid.
(…) although the exchange rate declined in theprevious weeks, it still remains above the previously-broken long termdeclining support/resistance line (marked with red). With this downward move,the pair declined to the horizontal green support line (created by the 2010high) and rebounded. Nevertheless, the size of the corrective upswing is stillquite small, which suggests that another attempt to move lower can’t be ruledout.
Before we summarizethis currency pair, let’s move on to the daily chart.
In our previous ForexTrading Alert, we wrote the following:
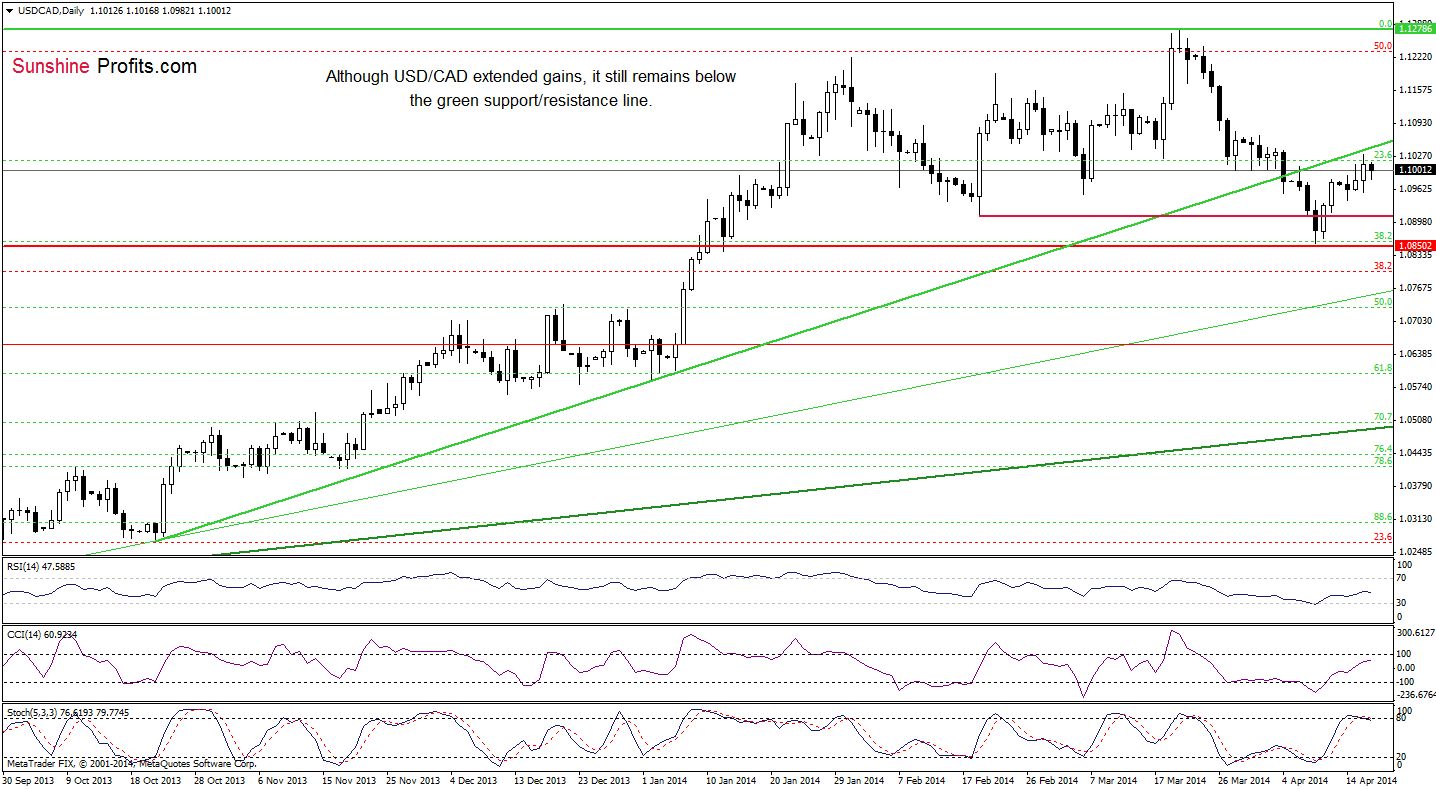
(…) ifthe buyers manage to push the exchange rate higher, we may see an increase tothe major resistance line (currently around 1.1026). Please note that the progrowth scenario is reinforced by the current position of the indicators (theRSI bounced off the level of 30, while buy signals generated by the CCI andStochastic Oscillator remain in place).
As you see on theabove chart, the buyers almost realized this bullish scenario yesterday.Despite this improvement, they didn’t manage to hold gained levels and theexchange rate reversed earlier today. Although the proximity to the resistanceline encouraged sellers to act, the pair still remains between yesterday’s highand low. On one hand, if USD/CAD moves above Wednesday high, we may see anotherattempt to break above the green resistance line. On the other hand, if thepair drops below yesterday’s low, we will likely see a pullback to around 1.0909(where the Feb.19 low is) or even to the April low of 1.0857.
Very short-termoutlook: mixed
Short-term outlook:mixed
MT outlook: bullish
LT outlook: bearish
Trading position(short-term): In our opinion no positions are justified from the risk/rewardperspective at the moment.
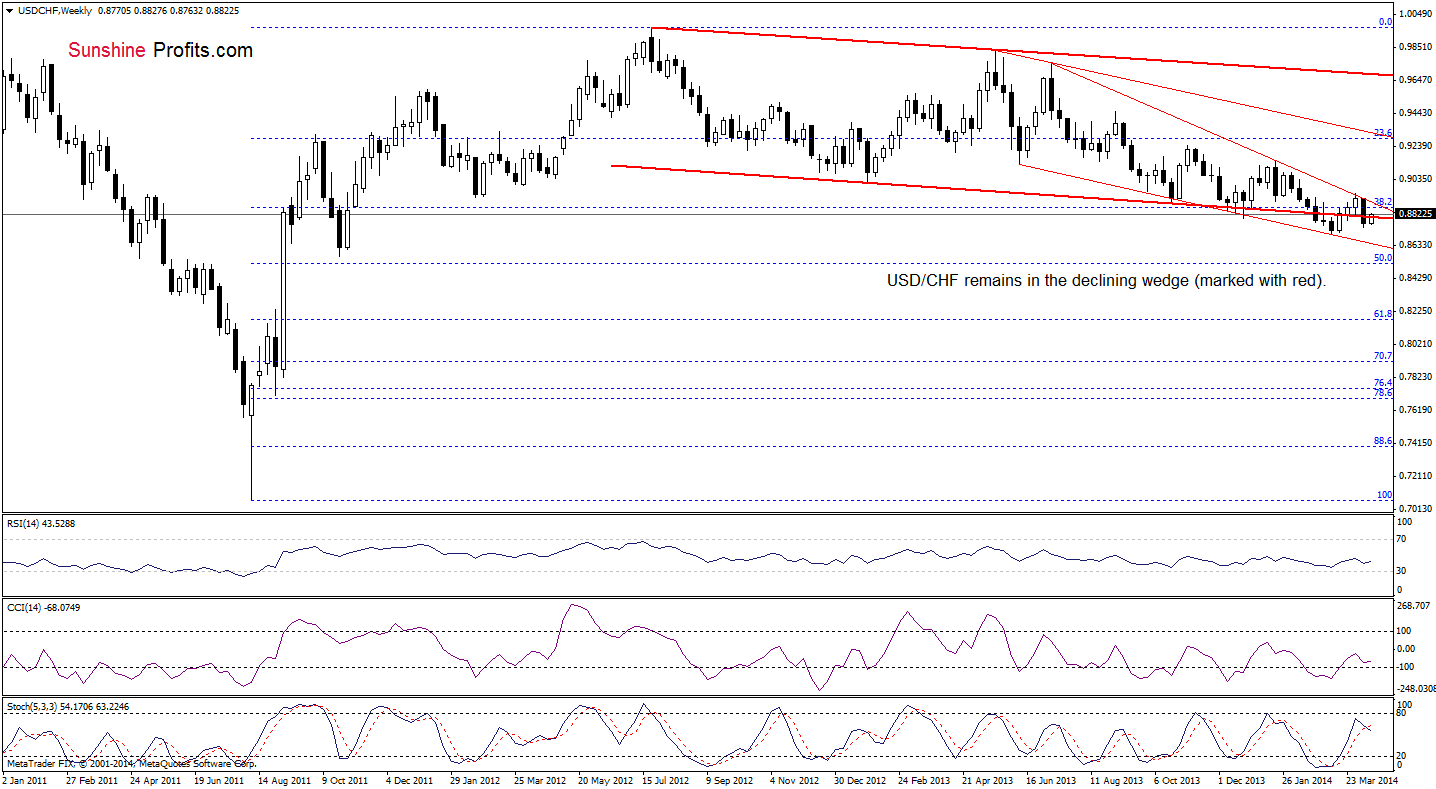
USD/CHF
From the weeklyperspective, we see that USD/CHF has been trading in the declining wedge sinceJuly. As you see on the above chart, the pair rebounded in March after a dropto the lower border of the formation, which resulted in further improvement andan increase to the upper line. However, this resistance stopped gains andtriggered a decline that took the exchange rate below the lower border of thedeclining trend channel (marked with red). Despite this drop, the buyers didn’tgive up and USD/CHF increased this week. Nevertheless, we should keep in mindthat even if the exchange rate climbs higher, the space for further increasesmay be limited by the upper line of the declining wedge (currently around 0.8900).
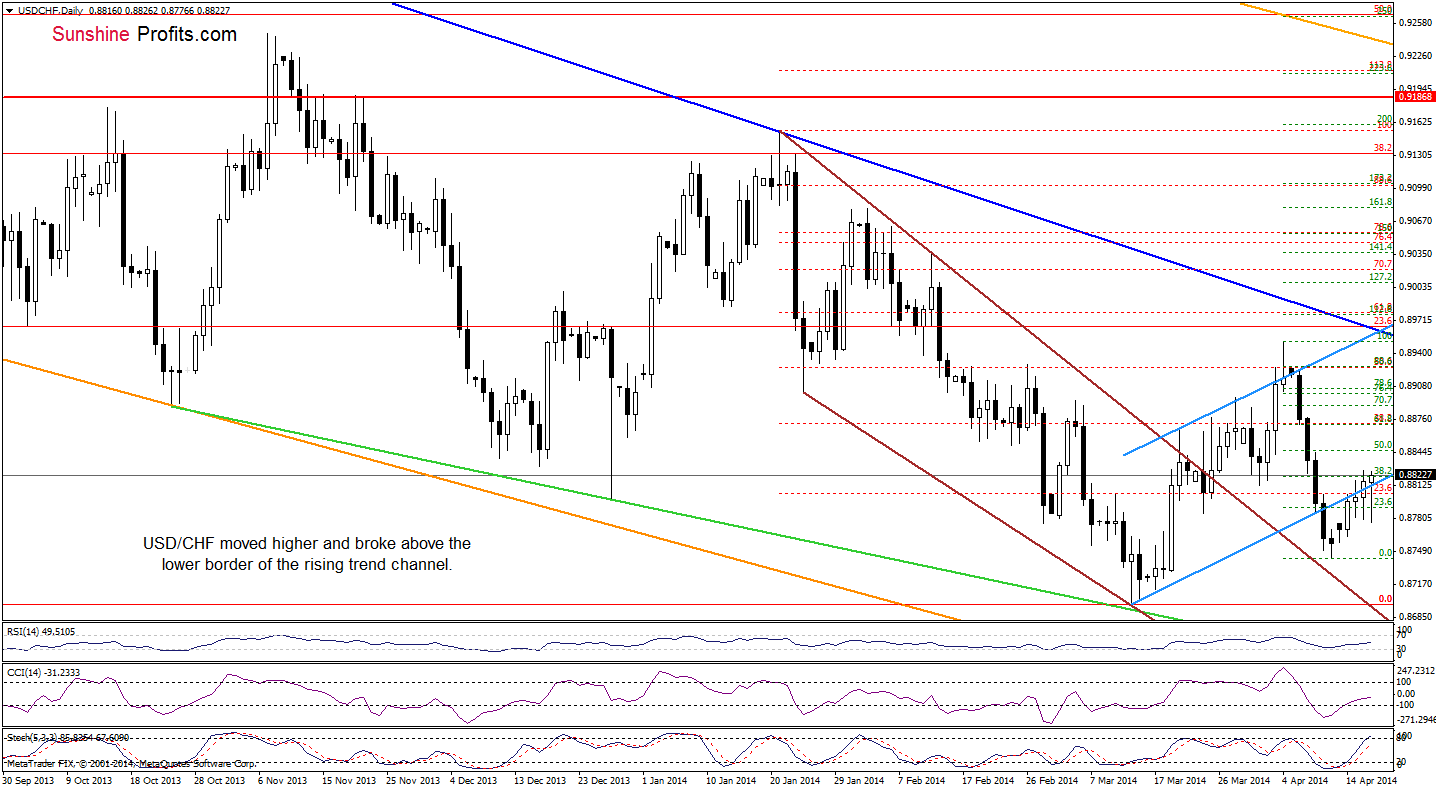
Once we know theabove, let’s take a closer look at the daily chart.
As you see on theabove chart, the buyers managed to close the previous day above the lowerborder of the blue rising trend channel, which was a bullish signal. AlthoughUSD/CHF slipped below this support line, the pair reversed and reboundedearlier today. With this upswing, the exchange rate not only erased earlierlosses, but also reached yesterday’s intraday high. As you see on the dailychart, this area is reinforced by the 38.2% Fibonacci retracement based on therecent decline. If it holds, we may see another attempt to move below the lowerborder of the trend channel. However, if it is broken, we will likely seefurther improvement and the first upside target will be around 0.8845, wherethe 50% Fibonacci retracement and the Apr.9 high are. If this level is broken,the next upside target will be slightly below the Apr.8 high, where the 61.8%Fibonacci retracement is (around 0.8872).
Very short-termoutlook: bullish
Short-term outlook:mixed
MT outlook: bearish
LT outlook: bearish
Trading position(short-term): In our opinion no positions are justified from the risk/rewardperspective at the moment.
AUD/USD
Quoting our lastForex Trading Alert:
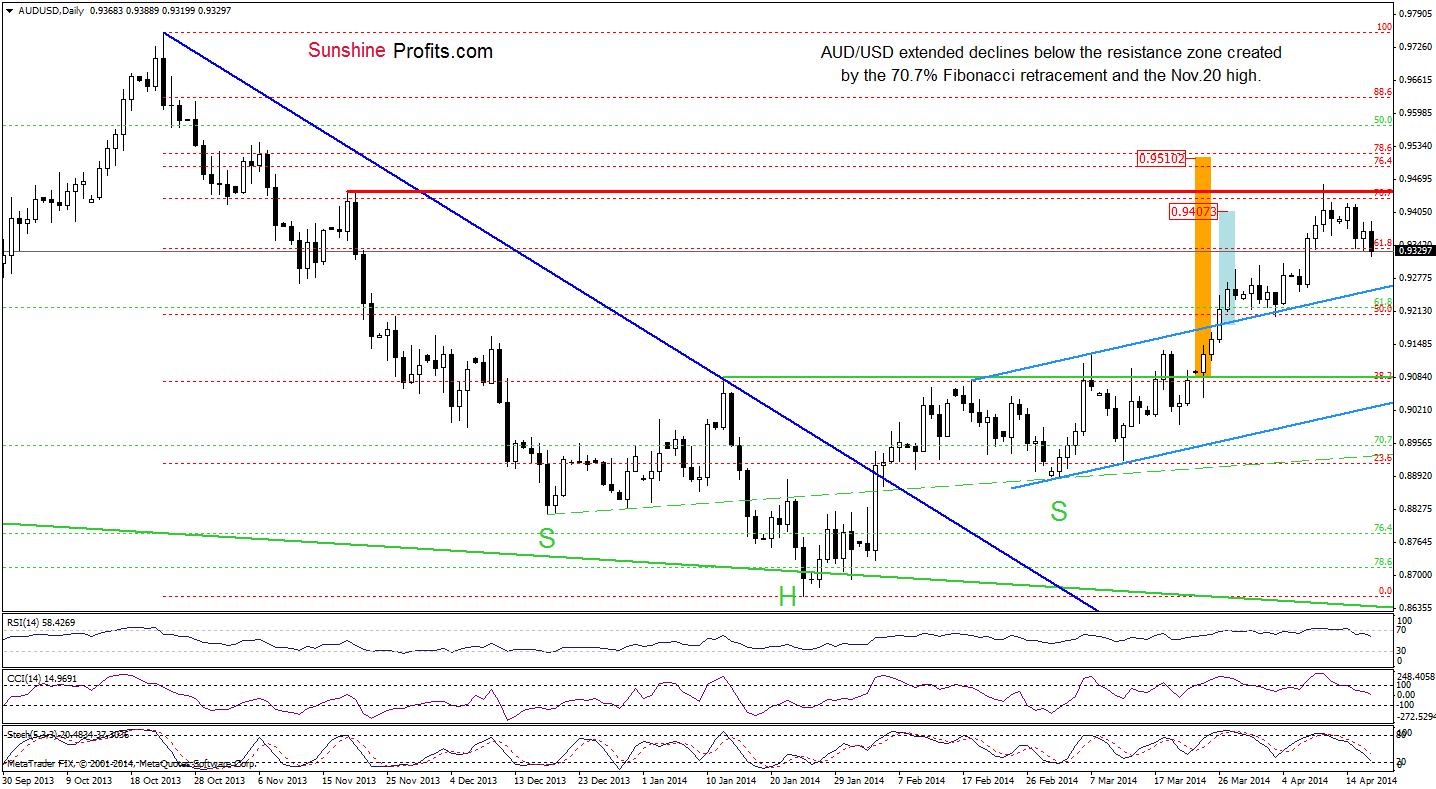
(…) the pair still remains below the resistancezone created by the 70.7% Fibonacci retracement and the Nov.20 high.Additionally, the size of a corrective upswing is too small to say that wewon’t see another attempt to move lower – especially when we factor in thecurrent position of the indicators (sell signals remain in place and stillfavor sellers). As a reminder, if the exchange rate extends declines, we maysee a pullback to the previously-broken upper line of the trend channel (…).
Looking at the abovechart, we see that the exchange rate not only erased yesterday’s gains, butalso dropped below an intraday low earlier today. As you see on the dailychart, sell signals remain in place, which suggests further deterioration and apullback to the previously-broken upper line of the trend channel (currentlyaround 0.9254).
Very short-termoutlook: bearish
Short-term outlook:mixed with bearish bias
MT outlook: bearish
LT outlook: bearish
Recommended Content
Editors’ Picks
AUD/USD keeps the red below 0.6400 as Middle East war fears mount

AUD/USD is keeping heavy losses below 0.6400, as risk-aversion persists following the news that Israel retaliated with missile strikes on a site in Iran. Fears of the Israel-Iran strife translating into a wider regional conflict are weighing on the higher-yielding Aussie Dollar.
USD/JPY recovers above 154.00 despite Israel-Iran escalation

USD/JPY is recovering ground above 154.00 after falling hard on confirmation of reports of an Israeli missile strike on Iran, implying that an open conflict is underway and could only spread into a wider Middle East war. Safe-haven Japanese Yen jumped, helped by BoJ Governor Ueda's comments.
Gold price pares gains below $2,400, geopolitical risks lend support

Gold price is paring gains to trade back below $2,400 early Friday, Iran's downplaying of Israel's attack has paused the Gold price rally but the upside remains supported amid mounting fears over a potential wider Middle East regional conflict.
WTI surges to $85.00 amid Israel-Iran tensions

Western Texas Intermediate, the US crude oil benchmark, is trading around $85.00 on Friday. The black gold gains traction on the day amid the escalating tension between Israel and Iran after a US official confirmed that Israeli missiles had hit a site in Iran.
Dogwifhat price pumps 5% ahead of possible Coinbase effect

Dogwifhat price recorded an uptick on Thursday, going as far as to outperform its peers in the meme coins space. Second only to Bonk Inu, WIF token’s show of strength was not just influenced by Bitcoin price reclaiming above $63,000.
