Trend boundary may be breached
In this review we would like to go back to the &GAS/OIL Personal composite instrument (PCI). It reflects the price dynamics of American Henry Hub natural gas in relation to theWTI oil futures. At the moment global oil prices drop due to the record surge in production. OPEC countries started extracting 31.6mln barrels per day, which clearly exceeds the 30mln quota. After lifting sanctions Iran is going to increase the export to 700 thousand barrels daily before the end of the year. Saudi Arabia, represented by Aramco state company, lowered Arab Light oil prices for South East buyers. The number of operating rigs in the US increased by 12 to 640. It has happened for the first time since December, 2014. Investors expect that by the end of the year this number will grow by at least 100. We would like to remind you that the all-time high for oil rigs was 1609 in October, 2014. Despite considerable contraction, the daily production has not decreased much since 1970, swinging around 9.6mln barrels. This year China is going to raise extraction by 500 thousand barrels daily as compared to the last year record of 4.2mln barrels. Yet, gas quotes remain relatively stable. Over the course of 4 month since the beginning of the year gas production in the US has expanded 9%, while consumption has added 2.3%. Meanwhile, according to Energy Information Administration, in 2015 gas extraction will rise only 5.7% and consumption will advance 4.4%. Thus, market participants expect the supply to decrease and the demand to grow in the second half of the year. Due to the price dynamics inside the base and the quoted parts the PCI tends to go up. Gas quotes may be affected by daily US reserves data that are usually released on Thursday. Last week the inventories contracted 8%.
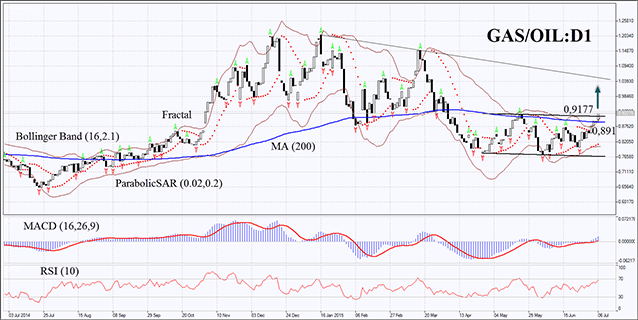
On the daily chart the GAS/OIL PCI reached the side range upper boundary. It crossed the 200-day Moving Average, the upper Bollinger Band and three latest fractal highs. MACD bars are located above the zero and the signal lines, demonstrating buy signals. Bollinger Bands started expanding, which may indicate volatility growth and trend strengthening. RSI-Bars have been moving up but has not yet reached the overbought zone. The bullish momentum may develop if the price breaks out the neutral trend upper boundary at 0.9177: a buy pending order may be placed there. A stop loss may be placed below the Moving Average at 0.891 or under the latest fractal high at 0.87. After pending order placing the stop loss is supposed to be moved every four hours near the next fractal low, following Bollinger and Parabolic signals. The most cautious traders are recommended to switch to the H4 time frame and place a stop loss, moving it after the trend. Thus, we are changing the probable profit/loss ratio to the breakeven point. If the price reaches the stop loss without triggering the order we recommend to cancel the position: the market sustains internal changes that were not considered.
PositionBuyBuy stopabove 0.9177Stop lossbelow 0.891 or 0.87
Recommended Content
Editors’ Picks
EUR/USD clings to daily gains above 1.0650

EUR/USD gained traction and turned positive on the day above 1.0650. The improvement seen in risk mood following the earlier flight to safety weighs on the US Dollar ahead of the weekend and helps the pair push higher.
GBP/USD recovers toward 1.2450 after UK Retail Sales data

GBP/USD reversed its direction and advanced to the 1.2450 area after touching a fresh multi-month low below 1.2400 in the Asian session. The positive shift seen in risk mood on easing fears over a deepening Iran-Israel conflict supports the pair.
Gold holds steady at around $2,380 following earlier spike

Gold stabilized near $2,380 after spiking above $2,400 with the immediate reaction to reports of Israel striking Iran. Meanwhile, the pullback seen in the US Treasury bond yields helps XAU/USD hold its ground.
Bitcoin Weekly Forecast: BTC post-halving rally could be partially priced in Premium

Bitcoin price shows no signs of directional bias while it holds above $60,000. The fourth BTC halving is partially priced in, according to Deutsche Bank’s research.
Week ahead – US GDP and BoJ decision on top of next week’s agenda

US GDP, core PCE and PMIs the next tests for the Dollar. Investors await BoJ for guidance about next rate hike. EU and UK PMIs, as well as Australian CPIs also on tap.