Here we consider the EURUSD currency pair on the D1 chart. The price is moving in the limits of W1 and D1 bearish downtrend, containing the falling Donchian Channel. At the moment, we can observe the price retracement completion: the last bar peak of RSI-Bars oscillator is located on the border of the overbought zone, and that means a prompt price reversal is about to happen when the oscillator signal leaves the triangle area. Parabolic values are moving along the daily trend line, confirming the trend. Donchian Channel confirmation will be obtained after the support level breakout at 1.23505, located below last two Bill Williams fractals. This mark can be used for opening a pending sell order with Stop Loss placed above 1.26072. This level is confirmed by the upper Donchian Channel boundary and the last resistance fractal.
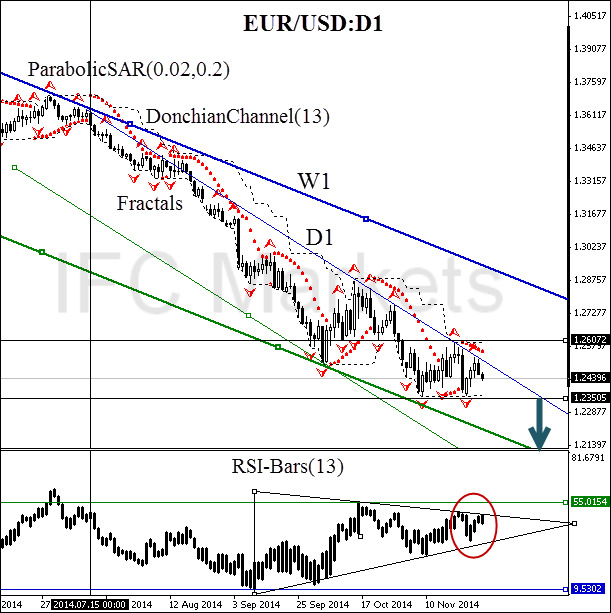
After position opening, Stop Loss is to be moved after the ParabolicSAR values, near the next fractal high. Thus, we are changing the probable profit/loss ratio to the breakeven point
- Position Sell
- Sell stop below 1.23505
- Stop loss above 1.26072
Recommended Content
Editors’ Picks
AUD/USD remained bid above 0.6500

AUD/USD extended further its bullish performance, advancing for the fourth session in a row on Thursday, although a sustainable breakout of the key 200-day SMA at 0.6526 still remain elusive.
EUR/USD faces a minor resistance near at 1.0750

EUR/USD quickly left behind Wednesday’s small downtick and resumed its uptrend north of 1.0700 the figure, always on the back of the persistent sell-off in the US Dollar ahead of key PCE data on Friday.
Gold holds around $2,330 after dismal US data

Gold fell below $2,320 in the early American session as US yields shot higher after the data showed a significant increase in the US GDP price deflator in Q1. With safe-haven flows dominating the markets, however, XAU/USD reversed its direction and rose above $2,340.
Bitcoin price continues to get rejected from $65K resistance as SEC delays decision on spot BTC ETF options

Bitcoin (BTC) price has markets in disarray, provoking a broader market crash as it slumped to the $62,000 range on Thursday. Meanwhile, reverberations from spot BTC exchange-traded funds (ETFs) continue to influence the market.
US economy: slower growth with stronger inflation

The dollar strengthened, and stocks fell after statistical data from the US. The focus was on the preliminary estimate of GDP for the first quarter. Annualised quarterly growth came in at just 1.6%, down from the 2.5% and 3.4% previously forecast.