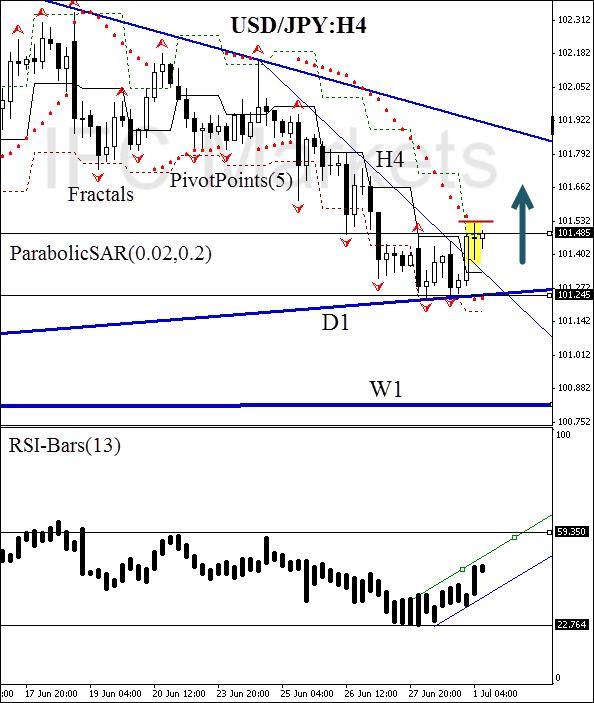
Good afternoon, dear traders. Here we consider the USD/JPY currency pair on the H4 chart. As we can see, the price broke the resistance of the H4 trend channel. This happened simultaneously with the bullish ParabolicSAR reversal and upward PivotPoints signal line crossing. There is no contradiction on the part of the RSI-Bars oscillator: the indicator confirms the upward movement.
Pending Buy Order is to be preliminary placed above the balance candle peak at 101.532. This key level is confirmed by theParabolicSAR historical values and the first PivotPoints resistance. Stop Loss is to be placed below the previous Bill Williams fractal at 101.245. This support is strengthened by the historical values of both trend indicators. Opening a position, it is recommended to move the Stop Loss after the parabolic values every 4 hours after the order execution. Thus, we can optimize the return/risk ratio in our favor in the process of changing market conditions. If you decide to take a break from the market, the automatic Trailing Stop can be placed, taking the distance between the two previous Parabolic indicator values into account.
Pending Buy Order is to be preliminary placed above the balance candle peak at 101.532. This key level is confirmed by theParabolicSAR historical values and the first PivotPoints resistance. Stop Loss is to be placed below the previous Bill Williams fractal at 101.245. This support is strengthened by the historical values of both trend indicators. Opening a position, it is recommended to move the Stop Loss after the parabolic values every 4 hours after the order execution. Thus, we can optimize the return/risk ratio in our favor in the process of changing market conditions. If you decide to take a break from the market, the automatic Trailing Stop can be placed, taking the distance between the two previous Parabolic indicator values into account.
Recommended Content
Editors’ Picks
EUR/USD steady near 1.0650 as markets gear up for PMI-heavy Tuesday

EUR/USD is testing the waters near 1.0650 after a quiet Monday saw the major pair flatline ahead of a densely-packed economic data docket. Both the US and the wider Eurozone area will see updates to Purchasing Managers Index (PMI) figures on Tuesday.
GBP/USD: Flat lines around mid-1.2300s, bearish potential seems intact

GBP/USD holds steady on Tuesday amid subdued USD demand, albeit lacks bullish conviction. The divergent Fed-BoE policy expectations turn out to be a key factor acting as a headwind. The technical setup suggests that the path of least resistance for the pair is to the downside.
Gold could see a rebound before resuming the correction

Gold price sees a fresh leg down in Asia on Tuesday even as risk flows dissipate. Receding fears over Middle East escalation offset subdued US Dollar and Treasury bond yields. Gold remains heavily oversold on the 4H chart, rebound appears in the offing.
PENDLE price soars 10% after Arthur Hayes’ optimism on Pendle derivative exchange

Pendle price is among the top performers in the cryptocurrency market today, posting double-digit gains. Its peers in the altcoin space are not as forthcoming even as the market enjoys bullish sentiment inspired by Bitcoin price.
After Monday's relief rally, attention shifts to earnings and policy fronts

With the easing of tensions in the Middle East, safe-haven demand reversed course; global stock markets experienced a modicum of relief. Indeed, in a classic relief rally fashion, Monday saw a rebound in the S&P 500, snapping a six-day losing streak.